Part 2: Statistical Analysis of Key Events in the Jacob-Levi Era in MT, LXX, SP, and Cumulative
For the full list of dates, see:
490d.com/mt-lxx-sp-sp215-regular-short-chronology-table/
490d.com/mt-lxx-sp-lifespan-accumulative-long-chronology-table/
Also, see:
Probability Analysis of Target Multiple 46 for Births of Adam to Moses with its Subtle Variations: MT Regular Chronology (“430 years in Egypt”).
Accumulative Age Probability Analysis in Biblical Chronologies, highlighting 460 years.
As expected, multiples of seven occur far more than randomness would when analyzing the period of Jacob and sons across all three major textual traditions of the MT, LXX and SP, including the Accumulative-Lifespan chronology.
Unexpectedly by this researcher, when this analysis was continued across all events from Terah to the Exodus and Conquest, the pattern collapsed, and multiples of seven were no longer statistically significant. As expected, though, multiples of 5, 10, and 40 became pronounced, but the most noteworthy was multiples of 160 (4 x40). This is significant because of the promise God made to Abraham:
In the fourth generation your descendants will come back here, for the sin of the Amorites has not yet reached its full measure.
Genesis 15:16
Part 1: Statistical Analysis of All Dates Given in MT from Terah to Joshua
Below is the full chart of dates extracted for analysis. The Python script allows one to subtract or add a date to tweak by the user, but these are the dates I have long settled upon without thought of statistical analysis.
| Terah | 2236 – 2031 | 205 | |
| Patriarchal Period | |||
|---|---|---|---|
| Abraham | 2166 – 1991 | 175 | Call of Abram (2091 BC), Covenant of Pieces (2081 BC), Covenant of Circumcision & Destruction of Sodom (2067 BC) |
| Sarah | 2156 – 2029 | 127 | |
| Ishmael | 2080 – 1943 | 137 | |
| Isaac | 2066 – 1886 | 180 | Wedding of Isaac (2026 BC) |
| Jacob | 2006 – 1859 | 147 | Jacob flees Esau (1929 BC) Jacob works for wives (1929-1922-1915 BC) Jacob returns to Canaan (1909 BC) |
| Esau | 2006 – ? | – | Esau marries (1966 BC) |
| Levi | 1919 – 1782 | 137 | |
| Judah | 1918 – 1789 | 129 | Death year per tradition |
| Joseph | 1915 – 1805 | 110 | Joseph sold as slave (1898 BC). Joseph’s release delayed two years (1887-1885) 7 years plenty (1885-1878 BC) 7 years famine (1878-1871 BC) |
| Benjamin | 1906 – ? | – | Birth of Benjamin (likely 1906 BC) |
| Egypt to Exodus | |||
| Israelites in Egypt | 1876 – 1446 | 430 | |
| Kohath | – | 133 | |
| Amram | – | 137 | |
| Aaron | 1529 – 1406 | 123 | Birth (summer of 1530 exact) Death (summer of 1407) |
| Moses | 1526 – 1406 | 120 | Birth (winter of 1526 exact) Flees to Midian (1486 BC) Exodus (1446 BC) Tabernacle (1445 BC) Death (winter of 1406) |
| Conquest (1406-1400 BC) First Sabbath year of rest (1399 BC) Conquest and Judges | |||
| Joshua, “And also וְגַם all that GENERATION died” (Judges 2:9-10) | 1476 – 1366 | 110 | “Generation” of 40-yrs implied (1406-1366) |
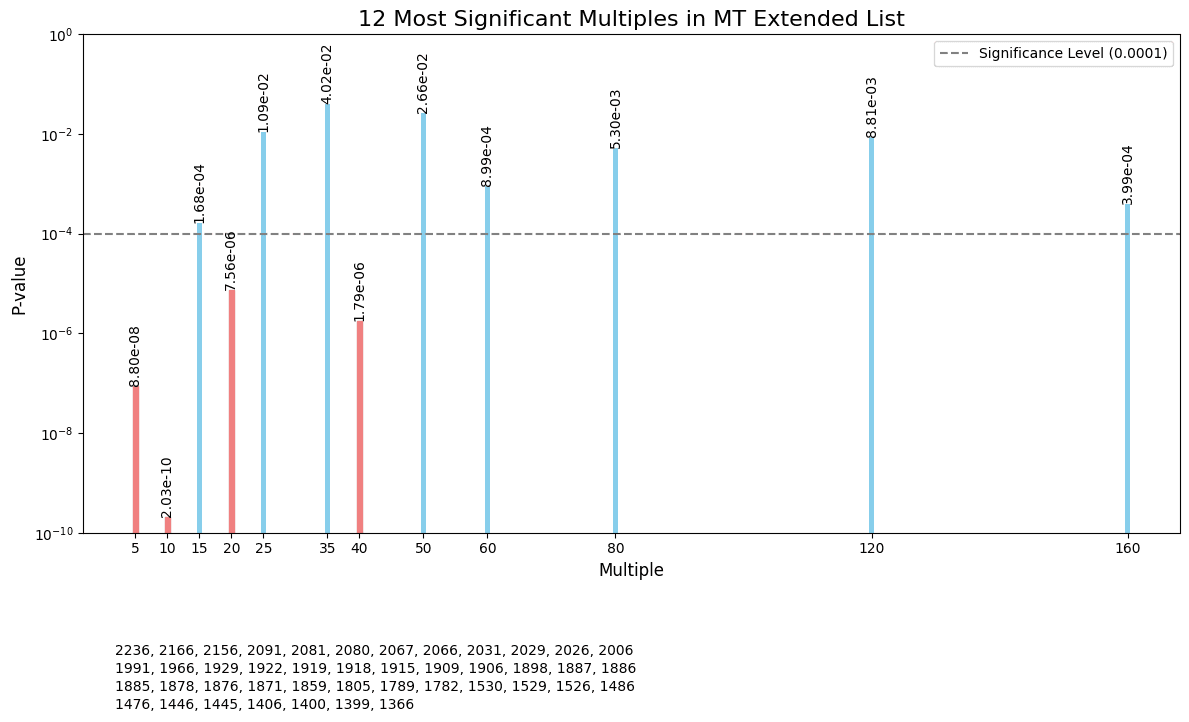
Notably, multiples of 160 (which is 4 x 40) emerge as the most significant observation. This finding is particularly intriguing because multiples of smaller numbers are generally expected due to the inherent schematic nature of the chronological list.
The analysis encompasses a wide range of multiples, including 1, 5, 7, 8, 10, 15, 16, 17, 18, 19, 20, 23, 25, 35, 40, 46, 49, 50, 60, 69, 70, 77, 80, 100, 120, 160, 161, 200, 280, 360, and 400. The prominence of the 160-year multiple suggests a potentially meaningful pattern in the chronology that goes beyond the more commonly expected smaller multiples.
The graph above depicts the statistical significance of various multiples in the chronological data. For a more detailed perspective, the table below focuses on just the series of multiples of 10, 20, 30, and so on. While we anticipate elevated significance across this series due to the nature of the data, the multiple of 160 stands out remarkably with seven instances. This prominence is particularly noteworthy when compared to other meaningful numbers in the biblical narrative.
For instance, both Joseph and Joshua are recorded as living for 110 years, yet the P-value for this multiple barely reaches the threshold of statistical significance. This contrast highlights the exceptional nature of the 160-year pattern within the chronology.
MT Specific Multiples Full Analysis – Extended List
| Multiple | Connections | Expected Connections | P-value |
|---|---|---|---|
| 10 | 53 | 21.000000 | 2.030453e-10 |
| 20 | 27 | 10.500000 | 7.564674e-06 |
| 30 | 20 | 7.000000 | 2.958250e-05 |
| 40 | 19 | 5.250000 | 1.790790e-06 |
| 50 | 9 | 4.200000 | 2.656265e-02 |
| 60 | 11 | 3.500000 | 8.992800e-04 |
| 70 | 6 | 3.000000 | 8.246501e-02 |
| 80 | 8 | 2.625000 | 5.302023e-03 |
| 90 | 6 | 2.333333 | 3.097341e-02 |
| 100 | 5 | 2.100000 | 6.117810e-02 |
| 110 | 5 | 1.909091 | 4.404071e-02 |
| 120 | 6 | 1.750000 | 8.812955e-03 |
| 130 | 2 | 1.615385 | 4.807875e-01 |
| 140 | 2 | 1.500000 | 4.427742e-01 |
| 150 | 3 | 1.400000 | 1.660153e-01 |
| 160 | 7 | 1.312500 | 3.994654e-04 |
| 170 | 3 | 1.235294 | 1.277533e-01 |
| 180 | 3 | 1.166667 | 1.128725e-01 |
| 190 | 2 | 1.105263 | 3.029984e-01 |
| 200 | 2 | 1.050000 | 2.826730e-01 |
| 210 | 1 | 1.000000 | 6.329982e-01 |
| 220 | 1 | 0.954545 | 6.158497e-01 |
| 230 | 2 | 0.913043 | 2.322236e-01 |
| 240 | 2 | 0.875000 | 2.182878e-01 |
| 250 | 2 | 0.840000 | 2.055357e-01 |
Further Explanation of the Above Multiple Search Analysis:
This analysis uses a Python script to search for multiples of specific numbers within a set of historical dates. The dates range from the time of Terah to Joshua, covering key events in biblical chronology.
Key Points:
1. Definition of Multiples:
- For example, multiples of 7 include 7, 14, 21, 28, 35, etc.
- Multiples of 120 would be 120, 240, 360, 480, 600, 720, 840, etc.
- The search is limited to the span of dates in the dataset.
2. Focus on the Comprehensive Dataset:
- The final results use the most comprehensive list of dates.
- This list includes all possible dates from Terah to Joshua without omitting minor details.
- It avoids unintentional bias by including all available dates.
3. Selective Inclusion of Births:
- The births of Levi (1919 BC), Judah (1918 BC), and Joseph (1915 BC) are included.
- Other births between 1921 BC and 1915 BC are omitted to avoid repetition.
4. Script and Data Source:
- The Python script was created by ChatGPT 4.
- Claude 3 Sonnet extracted the comprehensive list of dates from the provided chronological table.
- The analysis was run on Google Colab.
5. Purpose of the Analysis:
- To identify patterns in the chronology based on multiples of selected numbers.
- The script can be easily adjusted to search for different multiples or date ranges.
6. Interpretation:
- The results from the comprehensive list (the third list in the script) are considered the most significant.
- These results provide insights into potential patterns or alignments in the biblical chronology.
This analysis aims to uncover any statistical significance in the occurrence of certain multiples within the given chronology, potentially revealing underlying patterns in the historical timeline.
As seen in the graph below, multiples of ten occur least randomly.
Python Script:
Import necessary libraries
from scipy.stats import binomtest # Changed from binom_test to binomtest
import pandas as pd
Define the three lists of MT Dates
mt_dates_list1 = [
1406, 1526, 1529, 1792, 1859, 1886, 1919, 1991, 2006, 2029, 2031, 2066, 2156, 2166, 2236
]
mt_dates_list2 = [
1366, 1406, 1476, 1526, 1529, 1792, 1805, 1859, 1886, 1915, 1919, 1943, 1991, 2006, 2029, 2091, 2066, 2080, 2156, 2166, 2296
]
mt_dates = [
2236, 2166, 2156, 2091, 2081, 2080, 2067, 2066, 2031, 2029,
2026, 2006, 1991, 1966, 1929, 1922, 1919, 1918, 1915, 1909,
1906, 1898, 1887, 1886, 1885, 1878, 1876, 1871, 1859, 1805, 1789,
1782, 1530, 1529, 1526, 1486, 1476, 1446, 1445, 1406, 1400,
1399, 1366
]
Define the specific multiples to check
specific_multiples_full = [1, 5, 7, 8, 10, 15, 16, 17, 18, 19, 20, 23, 25, 35, 40, 46, 49, 50, 60, 69, 70, 77, 80, 100, 120, 160, 161, 200, 280, 360, 400]
Function to check if the difference between two dates is a multiple of a given number
def is_multiple_of(date1, date2, multiple):
return abs(date1 – date2) % multiple == 0
Function to calculate p-values
def calculate_p_values(dates, multiples):
results = {}
n = len(dates)
total_possible_connections = n * (n – 1) // 2
for multiple in multiples:
connections = sum(1 for i in range(n) for j in range(i + 1, n) if is_multiple_of(dates[i], dates[j], multiple))
expected_connections = total_possible_connections * (1 / multiple)
# Use binomtest instead of binom_test
p_value = binomtest(connections, total_possible_connections, 1 / multiple, alternative=’greater’).pvalue
results[multiple] = (connections, expected_connections, p_value)
return results
Calculate p-values for all three lists
mt_p_values_list1 = calculate_p_values(mt_dates_list1, specific_multiples_full)
mt_p_values_list2 = calculate_p_values(mt_dates_list2, specific_multiples_full)
mt_p_values_extended = calculate_p_values(mt_dates_extended, specific_multiples_full)
Convert results to DataFrames for better visualization
mt_p_values_list1_df = pd.DataFrame.from_dict(mt_p_values_list1, orient=’index’, columns=[‘Connections’, ‘Expected Connections’, ‘P-value’])
mt_p_values_list2_df = pd.DataFrame.from_dict(mt_p_values_list2, orient=’index’, columns=[‘Connections’, ‘Expected Connections’, ‘P-value’])
mt_p_values_extended_df = pd.DataFrame.from_dict(mt_p_values_extended, orient=’index’, columns=[‘Connections’, ‘Expected Connections’, ‘P-value’])
Display the DataFrames
print(“MT Specific Multiples Full Analysis – List 1”)
print(mt_p_values_list1_df)
print(“\nMT Specific Multiples Full Analysis – List 2”)
print(mt_p_values_list2_df)
print(“\nMT Specific Multiples Full Analysis – Extended List”)
print(mt_p_values_extended_df)
MT Specific Multiples Full Analysis – Extended List
This table provides an organized presentation of the connections, expected connections, and P-values for each multiple in the MT Specific Multiples
| Multiple | Connections | Expected Connections | P-value |
|---|---|---|---|
| 1 | 210 | 210 | 1.000000e+00 |
| 5 | 75 | 42.000000 | 8.796663e-08 |
| 7 | 35 | 30.000000 | 1.859718e-01 |
| 8 | 27 | 26.250000 | 4.688152e-01 |
| 10 | 53 | 21.000000 | 2.030453e-10 |
| 15 | 29 | 14.000000 | 1.675134e-04 |
| 16 | 12 | 13.125000 | 6.662573e-01 |
| 17 | 10 | 12.352941 | 7.951632e-01 |
| 18 | 10 | 11.666667 | 7.344979e-01 |
| 19 | 16 | 11.052632 | 8.964385e-02 |
| 20 | 27 | 10.500000 | 7.564674e-06 |
| 23 | 9 | 9.130435 | 5.646754e-01 |
| 25 | 16 | 8.400000 | 1.089575e-02 |
| 35 | 11 | 6.000000 | 4.024712e-02 |
| 40 | 19 | 5.250000 | 1.790790e-06 |
| 46 | 5 | 4.565217 | 4.813978e-01 |
| 49 | 5 | 4.285714 | 4.273657e-01 |
| 50 | 9 | 4.200000 | 2.656265e-02 |
| 69 | 6 | 3.043478 | 8.688058e-02 |
| 70 | 6 | 3.000000 | 8.246501e-02 |
| 77 | 1 | 2.727273 | 9.357605e-01 |
| 80 | 8 | 2.625000 | 5.302023e-03 |
| 100 | 5 | 2.100000 | 6.117810e-02 |
| 120 | 6 | 1.750000 | 8.812955e-03 |
| 160 | 7 | 1.312500 | 3.994654e-04 |
| 161 | 1 | 1.304348 | 7.297521e-01 |
| 200 | 2 | 1.050000 | 2.826730e-01 |
| 280 | 1 | 0.750000 | 5.282672e-01 |
| 360 | 1 | 0.583333 | 4.424176e-01 |
| 400 | 1 | 0.525000 | 4.088334e-01 |
Part 2: Statistical Analysis of Key Events in the Jacob-Levi Era in MT, LXX, SP, and Cumulative
Investigating Multiples of Seven and Ten: From Jacob to the Exodus/Conquest (1446 & 1406 BC)
A Comprehensive Examination of MT, LXX, SP, and Cumulative Chronologies
Explanation of the Multiple Search Analysis:
To maintain statistical integrity and avoid artificially inflating the P-value for multiples of seven, we apply the following criteria in our event selection:
- We exclude the seven years of Plenty and the seven years of Famine.
- For Jacob’s wedding, we only include the first seven years and omit the second seven years for Leah.
- We include Joseph’s birth but not the completion of Jacob’s 14 years of service.
- Esau’s wedding date is consistently included.
- Jacob and Esau’s birth is recorded as a single event, not two separate ones.
These guidelines ensure that our analysis does not overrepresent events that are inherently multiples of seven, allowing for a more accurate assessment of the chronological patterns.
For the full list of dates, see:
490d.com/mt-lxx-sp-sp215-regular-short-chronology-table/
490d.com/mt-lxx-sp-lifespan-accumulative-long-chronology-table/
P-values for MT, LXX, and SP
MT Dates:
Description MT Date
Birth of Jacob / Birth of Esau 2006 BC
Death of Abraham 1991 BC
Esau marries 1966 BC
Death of Shem=End of era 1956 BC
Start of Jacob working for wives / Jacob flees Esau 1929 BC
End of Jacob working for wives 1922 BC
Birth of Levi 1919 BC
Birth of Joseph 1915 BC
Jacob returns to Canaan 1909 BC
Joseph sold as slave 1898 BC
Death of Isaac 1886 BC
Marriage of Joseph and start of 7-yr plenty 1885 BC
Start of 7-yr famine 1878 BC
Start of Israelites in Egypt 1876 BC
End of 7 years famine 1871 BC
Death of Jacob 1859 BC
Death of Joseph 1805 BC
Death of Levi 1782 BC
End of Israelites in Egypt 1446 BC
Conquest 1406 BC
MT Dates:
| Description | MT Date |
|---|---|
| Birth of Jacob / Birth of Esau | 2006 BC |
| Esau marries | 1966 BC |
| Start of Jacob working for wives / Jacob flees Esau | 1929 BC |
| End of Jacob working for wives | 1922 BC |
| Birth of Levi | 1919 BC |
| Birth of Joseph | 1915 BC |
| Jacob returns to Canaan | 1909 BC |
| Start of Israelites in Egypt | 1876 BC |
| End of 7 years famine | 1871 BC |
| Death of Jacob | 1859 BC |
| Death of Joseph | 1805 BC |
| Death of Levi | 1782 BC |
| End of Israelites in Egypt | 1446 BC |
| Conquest | 1406 BC |
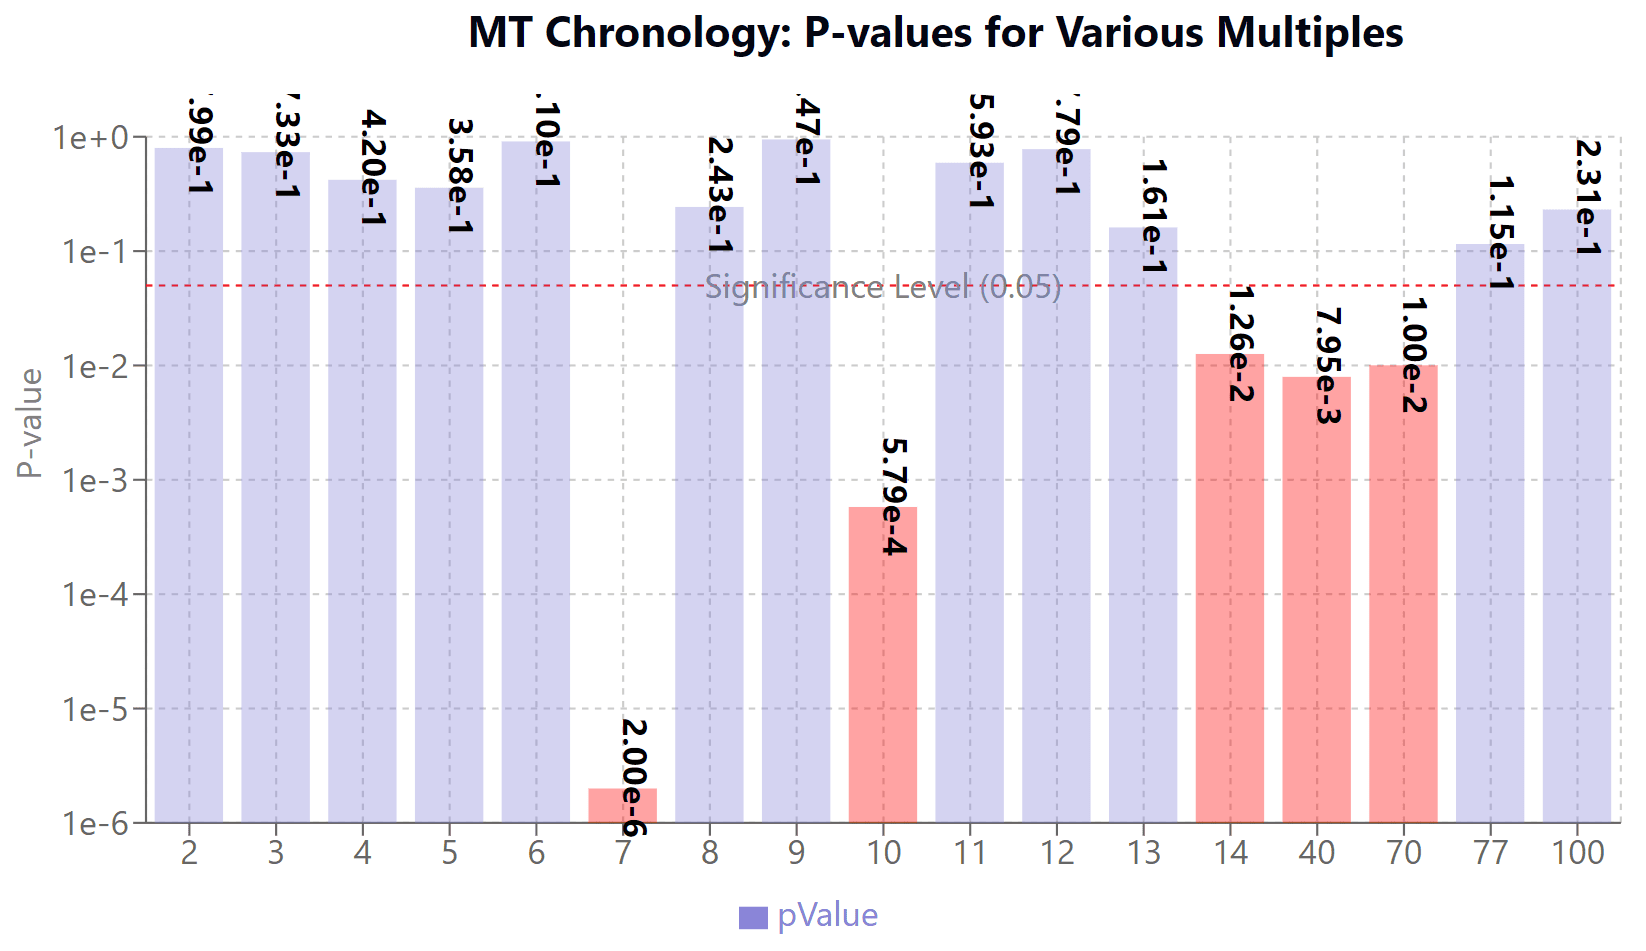
P-values for MT
| Multiple | MT P-value |
|---|---|
| 2 | 0.799094 |
| 3 | 0.733087 |
| 4 | 0.420358 |
| 5 | 0.358075 |
| 6 | 0.910063 |
| 7 | 0.000002 |
| 8 | 0.243417 |
| 9 | 0.947195 |
| 10 | 0.000579 |
| 11 | 0.592629 |
| 12 | 0.779457 |
| 13 | 0.161235 |
| 14 | 0.012603 |
| 40 | 0.007948 |
| 70 | 0.010040 |
| 77 | 0.115441 |
| 100 | 0.231009 |
LXX Dates:
| Description | LXX Date |
|---|---|
| Birth of Jacob / Birth of Esau | 1973 BC |
| Esau marries | 1933 BC |
| Start of Jacob working for wives / Jacob flees Esau | 1896 BC |
| End of Jacob working for wives | 1889 BC |
| Birth of Levi | 1886 BC |
| Birth of Joseph | 1882 BC |
| Jacob returns to Canaan | 1876 BC |
| Start of Israelites in Egypt | 1843 BC |
| End of 7 years famine | 1838 BC |
| Death of Jacob | 1826 BC |
| Death of Joseph | 1772 BC |
| Death of Levi | 1749 BC |
| End of Israelites in Egypt | 1446 BC |
| Conquest | 1406 BC |
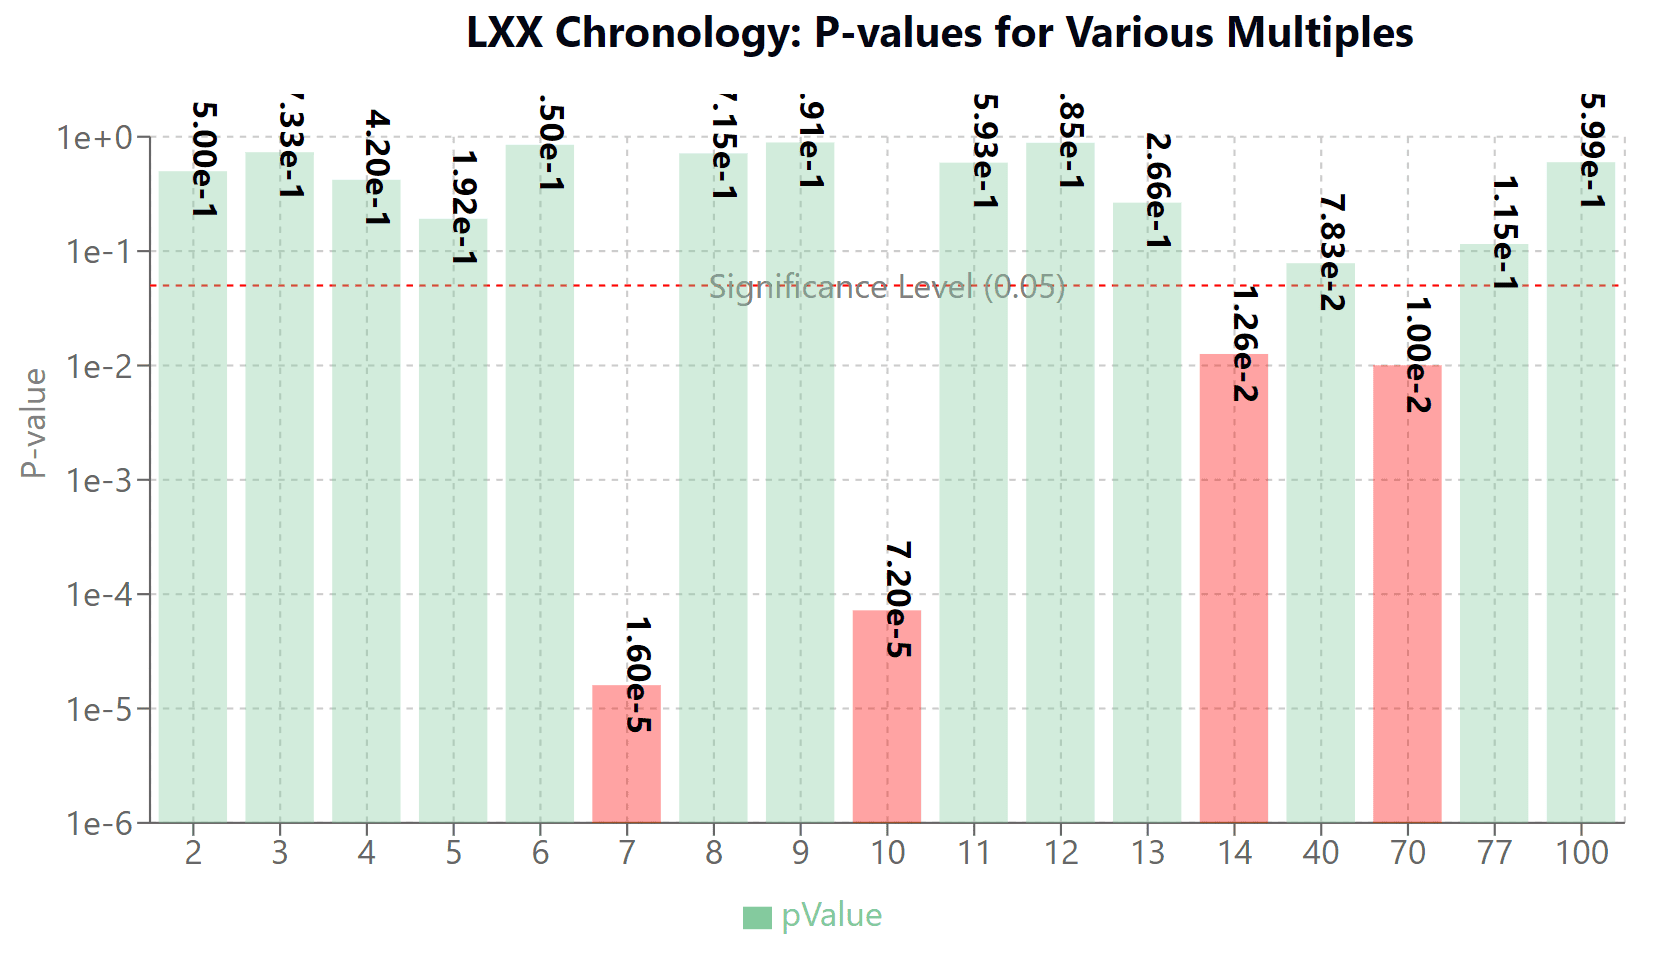
P-values for LXX
| Multiple | LXX P-value |
|---|---|
| 2 | 0.500000 |
| 3 | 0.733087 |
| 4 | 0.420358 |
| 5 | 0.191645 |
| 6 | 0.849678 |
| 7 | 0.000016 |
| 8 | 0.714864 |
| 9 | 0.890907 |
| 10 | 0.000072 |
| 11 | 0.592629 |
| 12 | 0.884598 |
| 13 | 0.265516 |
| 14 | 0.012603 |
| 40 | 0.078340 |
| 70 | 0.010040 |
| 77 | 0.115441 |
| 100 | 0.599315 |
SP Dates:
| Description | SP Date |
|---|---|
| Birth of Jacob / Birth of Esau | 1791 BC |
| Esau marries | 1751 BC |
| Start of Jacob working for wives / Jacob flees Esau | 1714 BC |
| End of Jacob working for wives | 1707 BC |
| Birth of Levi | 1704 BC |
| Birth of Joseph | 1700 BC |
| Jacob returns to Canaan | 1694 BC |
| Start of Israelites in Egypt | 1661 BC |
| End of 7 years famine | 1656 BC |
| Death of Jacob | 1644 BC |
| Death of Joseph | 1590 BC |
| Death of Levi | 1567 BC |
| End of Israelites in Egypt | 1446 BC |
| Conquest | 1406 BC |
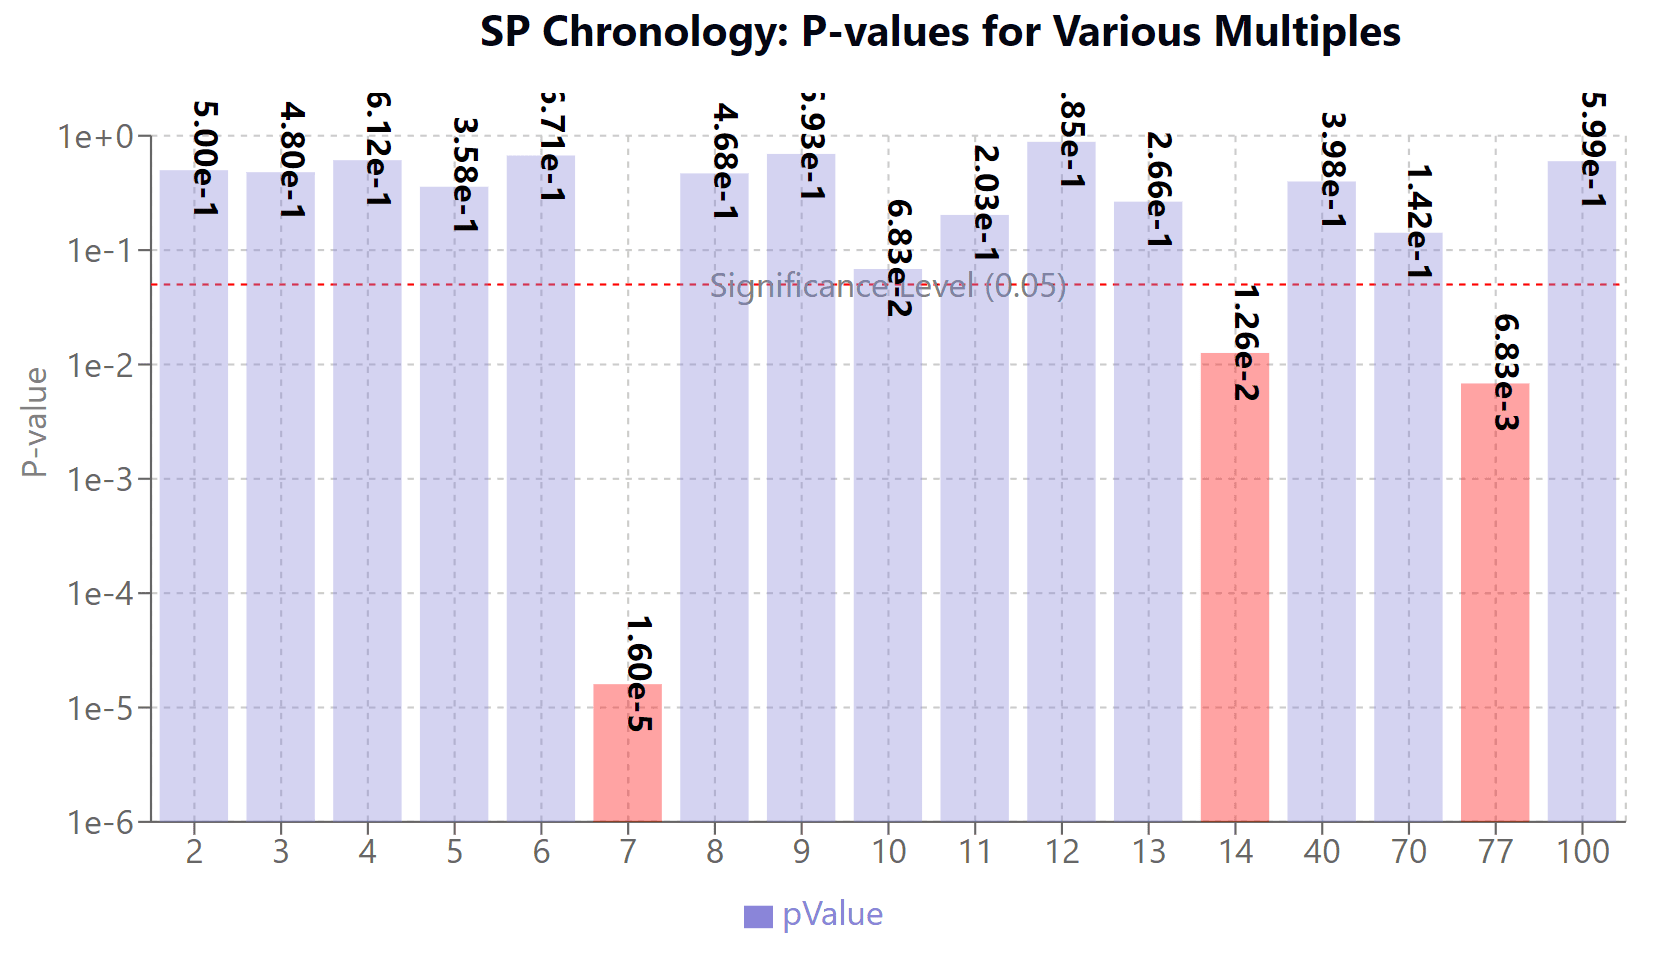
P-values for SP
| Multiple | SP P-value |
|---|---|
| 2 | 0.500000 |
| 3 | 0.480289 |
| 4 | 0.611714 |
| 5 | 0.358075 |
| 6 | 0.671310 |
| 7 | 0.000016 |
| 8 | 0.468305 |
| 9 | 0.693330 |
| 10 | 0.068291 |
| 11 | 0.203135 |
| 12 | 0.884598 |
| 13 | 0.265516 |
| 14 | 0.012603 |
| 40 | 0.398240 |
| 70 | 0.141718 |
| 77 | 0.006830 |
| 100 | 0.599315 |
Cumulative Lifespan Chronology Analysis
For the full list of dates, see:
490d.com/mt-lxx-sp-sp215-regular-short-chronology-table/
490d.com/mt-lxx-sp-lifespan-accumulative-long-chronology-table/
Lists of Dates and P-values for Cumulative Sets
Cumulative Set 1 Dates:
| Description | Date |
|---|---|
| Jacob lived 147 years | 2083 BC |
| Levi lived 137 years | 1936 BC |
| Kohath lived 133 years | 1799 BC |
| End of Israelites in Egypt | 1446 BC |
| Conquest | 1406 BC |
P-values for Cumulative Set 1
| Multiple | P-value |
|---|---|
| 7 | 0.161605 |
| 10 | 0.070191 |
| 70 | 0.134015 |
Cumulative Set 2 Dates:
| Description | Date |
|---|---|
| Jacob lived 147 years | 2080 BC |
| Levi lived 137 years | 1933 BC |
| Kohath lived 133 years | 1796 BC |
| End of Israelites in Egypt | 1446 BC |
| Conquest | 1406 BC |
P-values for Cumulative Set 2
| Multiple | P-value |
|---|---|
| 7 | 0.429178 |
| 10 | 0.070191 |
| 70 | 0.134015 |
Cumulative Set 3 Dates:
| Description | Date |
|---|---|
| Jacob lived 147 years | 2085 BC |
| Levi lived 137 years | 1938 BC |
| Kohath lived 133 years | 1781 BC |
| End of Israelites in Egypt | 1446 BC |
| Conquest | 1406 BC |
P-values for Cumulative Set 3
| Multiple | P-value |
|---|---|
| 7 | 0.161605 |
| 10 | 0.651322 |
| 70 | 1.000000 |
Cumulative Set 4 Dates:
| Description | Date |
|---|---|
| Jacob lived 147 years | 2078 BC |
| Levi lived 137 years | 1931 BC |
| Kohath lived 133 years | 1794 BC |
| End of Israelites in Egypt | 1446 BC |
| Conquest | 1406 BC |
P-values for Cumulative Set 4
| Multiple | P-value |
|---|---|
| 7 | 0.161605 |
| 10 | 0.651322 |
| 70 | 1.000000 |
Also, see:
Probability Analysis of Target Multiple 46 for Births of Adam to Moses with its Subtle Variations: MT Regular Chronology (“430 years in Egypt”).
Accumulative Age Probability Analysis in Biblical Chronologies, highlighting 460 years.