So Simon Peter went aboard and dragged the net ashore. It was full of large fish, 153, but even with so many, the net was not torn.
This detailed companion to The 153 Fish: A Pattern of Generations examines the proposed relationship between John’s fish count and a schematic chronology of generations. It develops the age inputs, the selected genealogy, the dated boundaries and the common-center calculation, so that each step can be checked independently.
The central relationship is 77 + 77 − 1 = 153. Two sequences of 77 generation blocks share one block. Count the common block once, and their combined extent contains 153 blocks; count it in each sequence, and their lengths add to 154. At 70 years per block, these totals are 10710 and 10780 years. The latter equals 22 × 490.
This is exact arithmetic within a defined model. Its relationship to John 21:11 is a proposed theological correspondence. The purpose of the study is to make both the calculation and the interpretation clear.
1. The narrative and its number
In John 21:1–14, the disciples’ unsuccessful night gives way to a remarkable catch when they follow Jesus’ direction. Peter brings the net ashore; the fish are counted; the net remains intact. Jesus then shares a meal with the disciples. The number 153 belongs within this account of the risen Jesus and the disciples’ encounter with him.
The passage gives an exact count, but it does not identify the fish as generations or prescribe a conversion of fish into years. That distinction determines the order of the argument. We begin with the narrative datum, identify the chronological units used in the proposed comparison, and then ask what kind of theological reading the numerical relationship can support.
The generational framework is developed in the repository’s File 15. The particular 153-block relationship is stated in File 54 Appendix B.2, within its schematic study of Luke’s genealogy. The detailed name inventory comes from File 43, while File 69 helps preserve the distinctions among names, occupied positions, intervals and completed blocks. These studies supply the model being examined; they are not additional words of John 21.
2. Three generational measures
The model employs 40-, 70- and 100-year units. These lengths are selected from the portions of Moses’, Jacob’s and Abraham’s lives associated with their calling and subsequent service. They are measuring standards for structural comparison, rather than estimates of an ordinary parent-to-child interval.
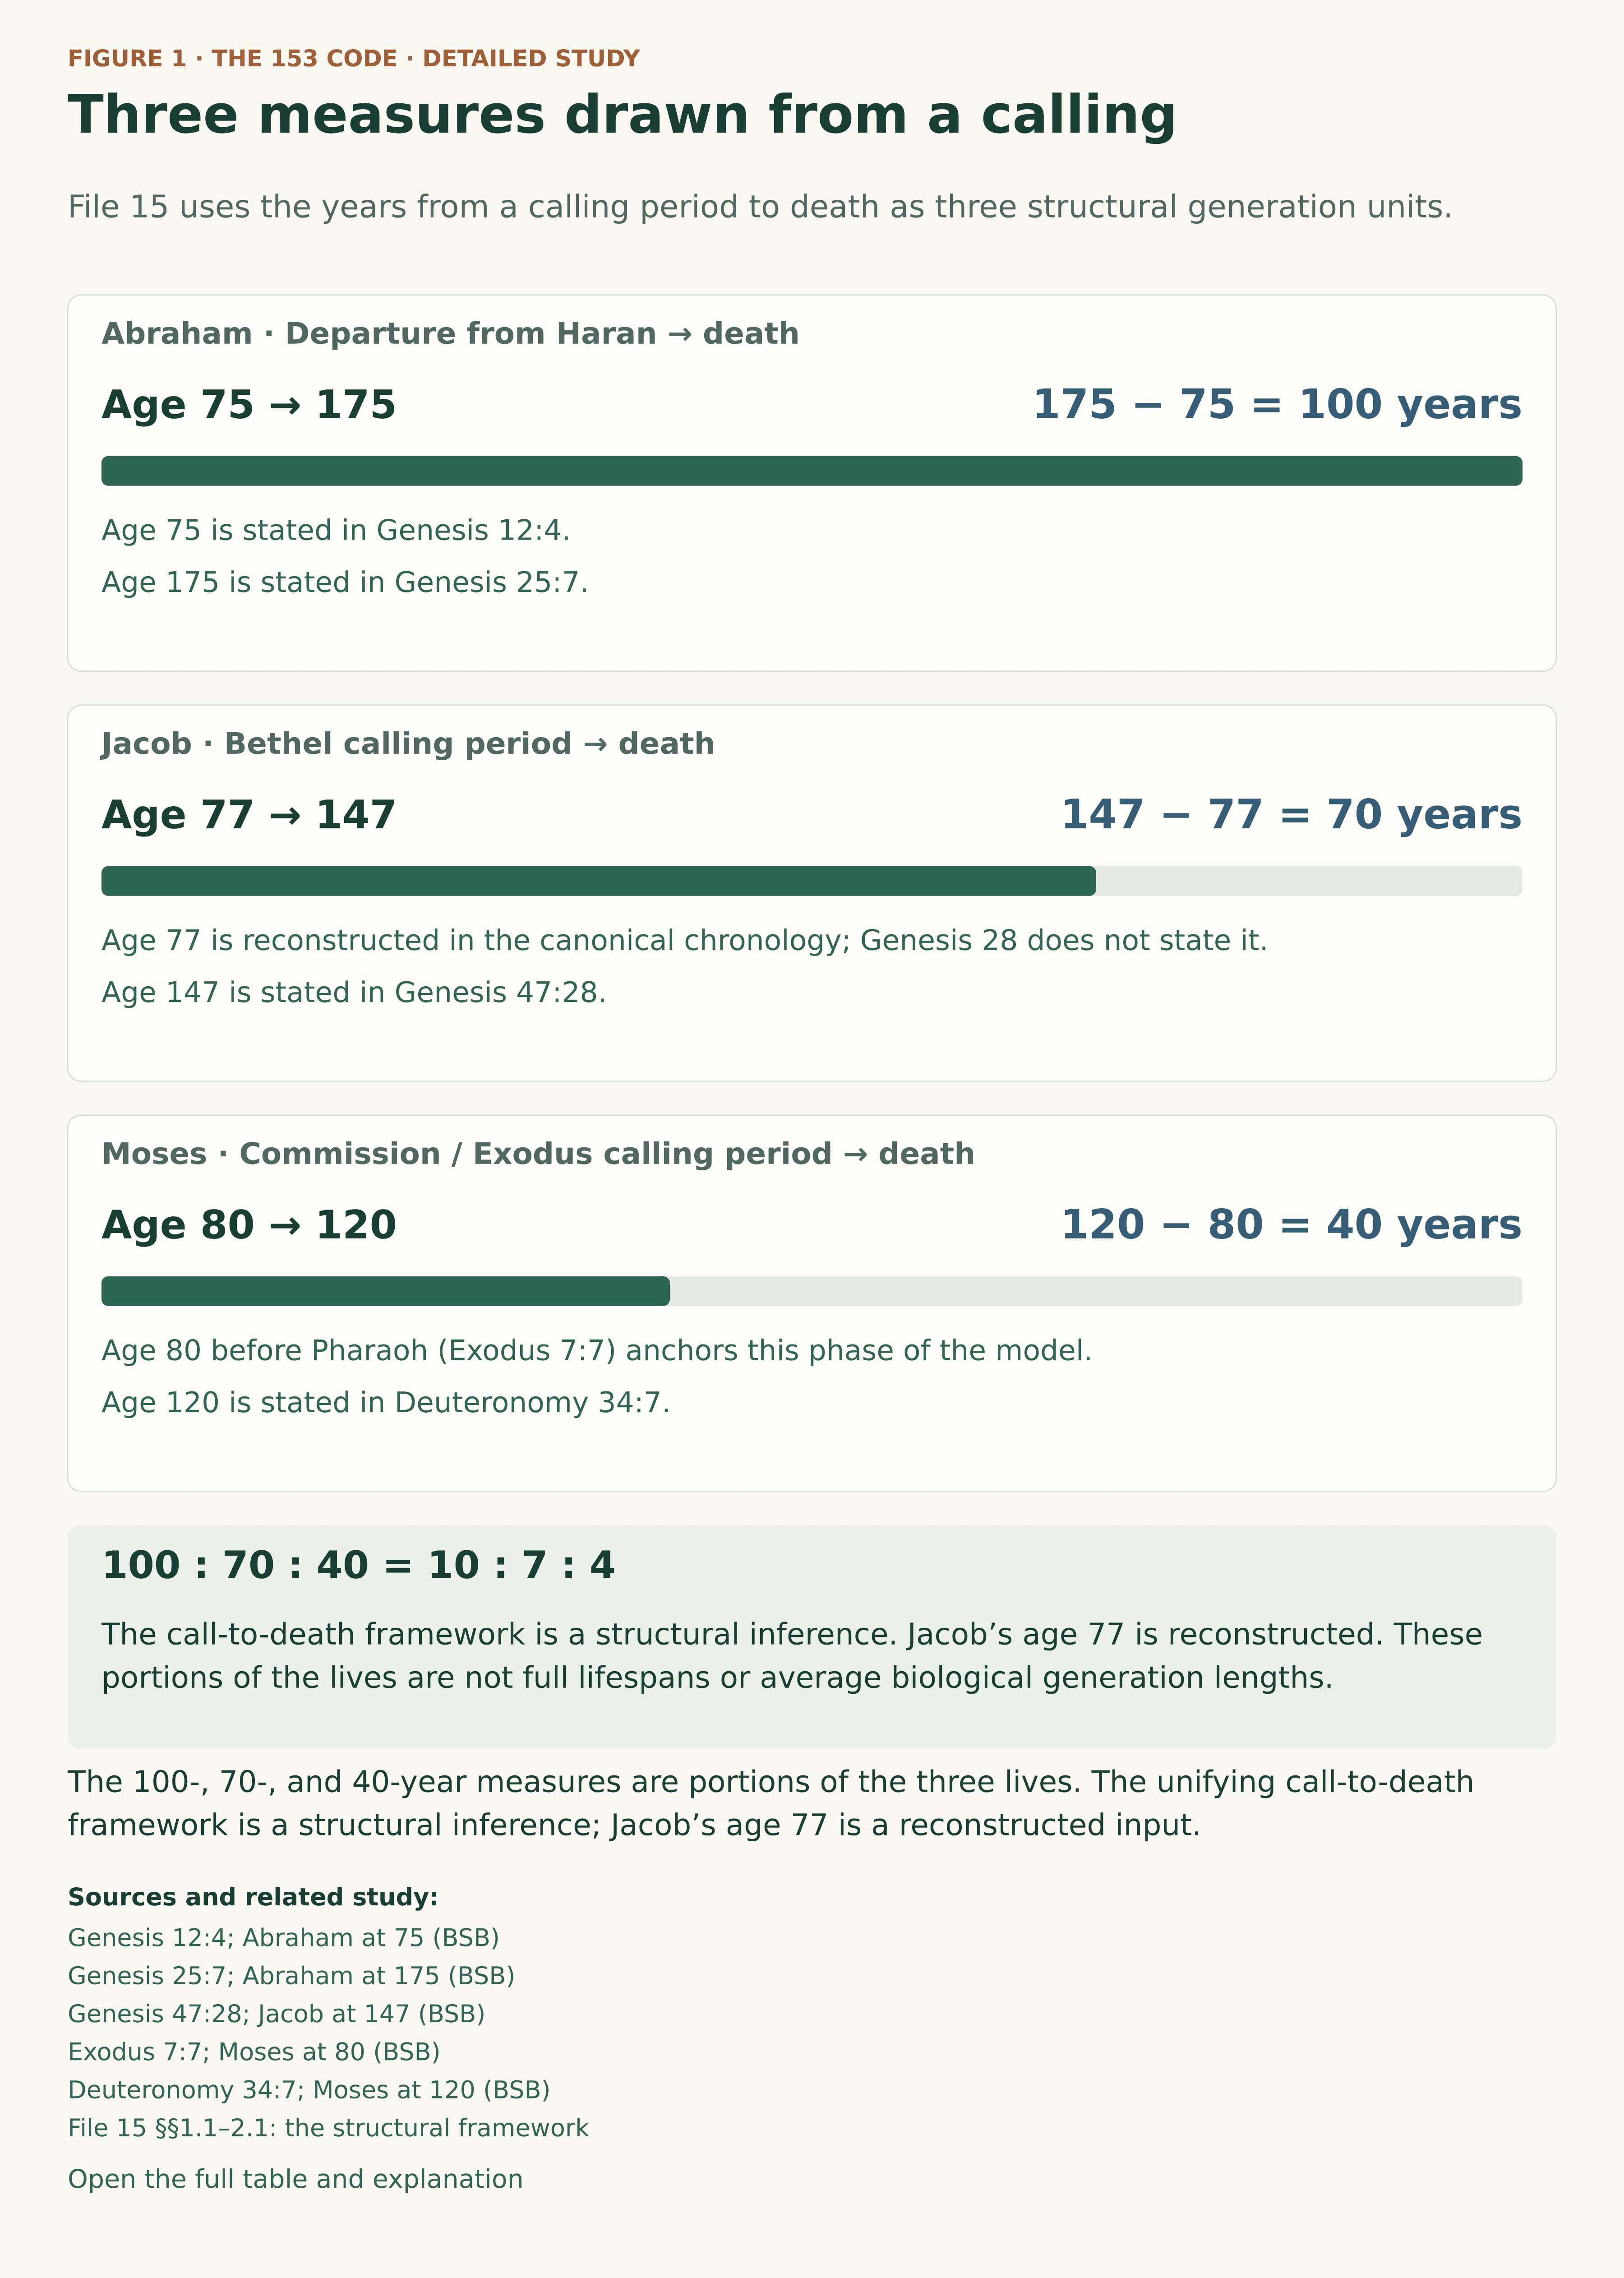
Abraham was 75 when he departed Haran and lived to 175. Moses was 80 when he spoke to Pharaoh and lived to 120. Jacob lived to 147; the repository chronology places his flight to Haran and encounter at Bethel at age 77. Subtracting those starting ages gives the three selected spans.
Figure 1 · The 153 Code · Detailed Study
Three measures drawn from a calling
File 15 uses the years from a calling period to death as three structural generation units.
Abraham
Age 75 → 175
Departure from Haran → death
175 − 75 = 100
100-year unit
Jacob
Age 77 → 147
Bethel calling period → death
147 − 77 = 70
70-year unit
Age 77 is reconstructed in the canonical chronology; Genesis 28 does not state it.
Moses
Age 80 → 120
Commission / Exodus calling period → death
120 − 80 = 40
40-year unit
Age 80 before Pharaoh (Exodus 7:7) anchors this phase of the model.
Sources: Genesis 12:4; Abraham at 75 (BSB) · Genesis 25:7; Abraham at 175 (BSB) · Genesis 47:28; Jacob at 147 (BSB) · Exodus 7:7; Moses at 80 (BSB) · Deuteronomy 34:7; Moses at 120 (BSB) · File 15 §§1.1–2.1: the structural framework.
Model and calculation details
The arithmetic is 175 − 75 = 100; 147 − 77 = 70; and 120 − 80 = 40. Genesis 12:4 states Abraham’s age when he departs Haran. Jacob’s age at Bethel is reconstructed in the canonical chronology, not supplied by Genesis 28. Exodus 7:7 states Moses’ age when he speaks to Pharaoh, while File 15 treats age 80 as the calling period for the Exodus phase. These units are not generic biological generation lengths or the men’s full lifespans.

| Person / measure | Age calculation | Starting event and source (BSB) | Death age source (BSB) | Evidence |
|---|---|---|---|---|
| Abraham / 100 years | 175 − 75 = 100 | Departure from Haran; Genesis 12:4 | Genesis 25:7 | Both ages explicit; selecting this life portion as a standard is structural. |
| Jacob / 70 years | 147 − 77 = 70 | Flight to Haran / Bethel; Genesis 28:10–22 | Genesis 47:28 | Starting age 77 reconstructed in Files 04 and 15; death age 147 explicit. |
| Moses / 40 years | 120 − 80 = 40 | Speaking to Pharaoh; Exodus 7:7 | Deuteronomy 34:7 | Both ages explicit; the 80-year marker belongs to the call/Exodus transition. |
The source status of the inputs matters. Abraham’s age is expressly attached to his departure from Haran in Genesis 12:4. Moses’ age is expressly attached to speaking to Pharaoh in Exodus 7:7. The burning-bush commission belongs to that wider transition, and Acts 7:23 and 7:30 supply the earlier forty-year stages. The numerical starting point should retain this narrative setting.
Jacob’s age 77 has a different basis. Genesis 28 recounts the Bethel encounter without stating his age. File 15 inherits from File 04 the chronological sequence 2006 BC birth → 1929 BC flight → 1859 BC death. Thus 2006 − 1929 = 77, while 1929 − 1859 = 70. The reconstruction supplies the starting age; Genesis 47:28 supplies the lifespan of 147.
File 15 describes the common calling-to-death rationale as a structural axiom. That rationale selects comparable portions of three lives without changing the full lifespans. Abraham remains 175, Jacob 147 and Moses 120 years old at death. Their selected units are 100, 70 and 40 years.
The exact proportion is 100 : 70 : 40 = 10 : 7 : 4. It can equally be displayed in ascending order as 40 : 70 : 100 = 4 : 7 : 10. A change of unit changes the measured total; it does not change the events from which the unit was derived.
3. A common 1400-year scale
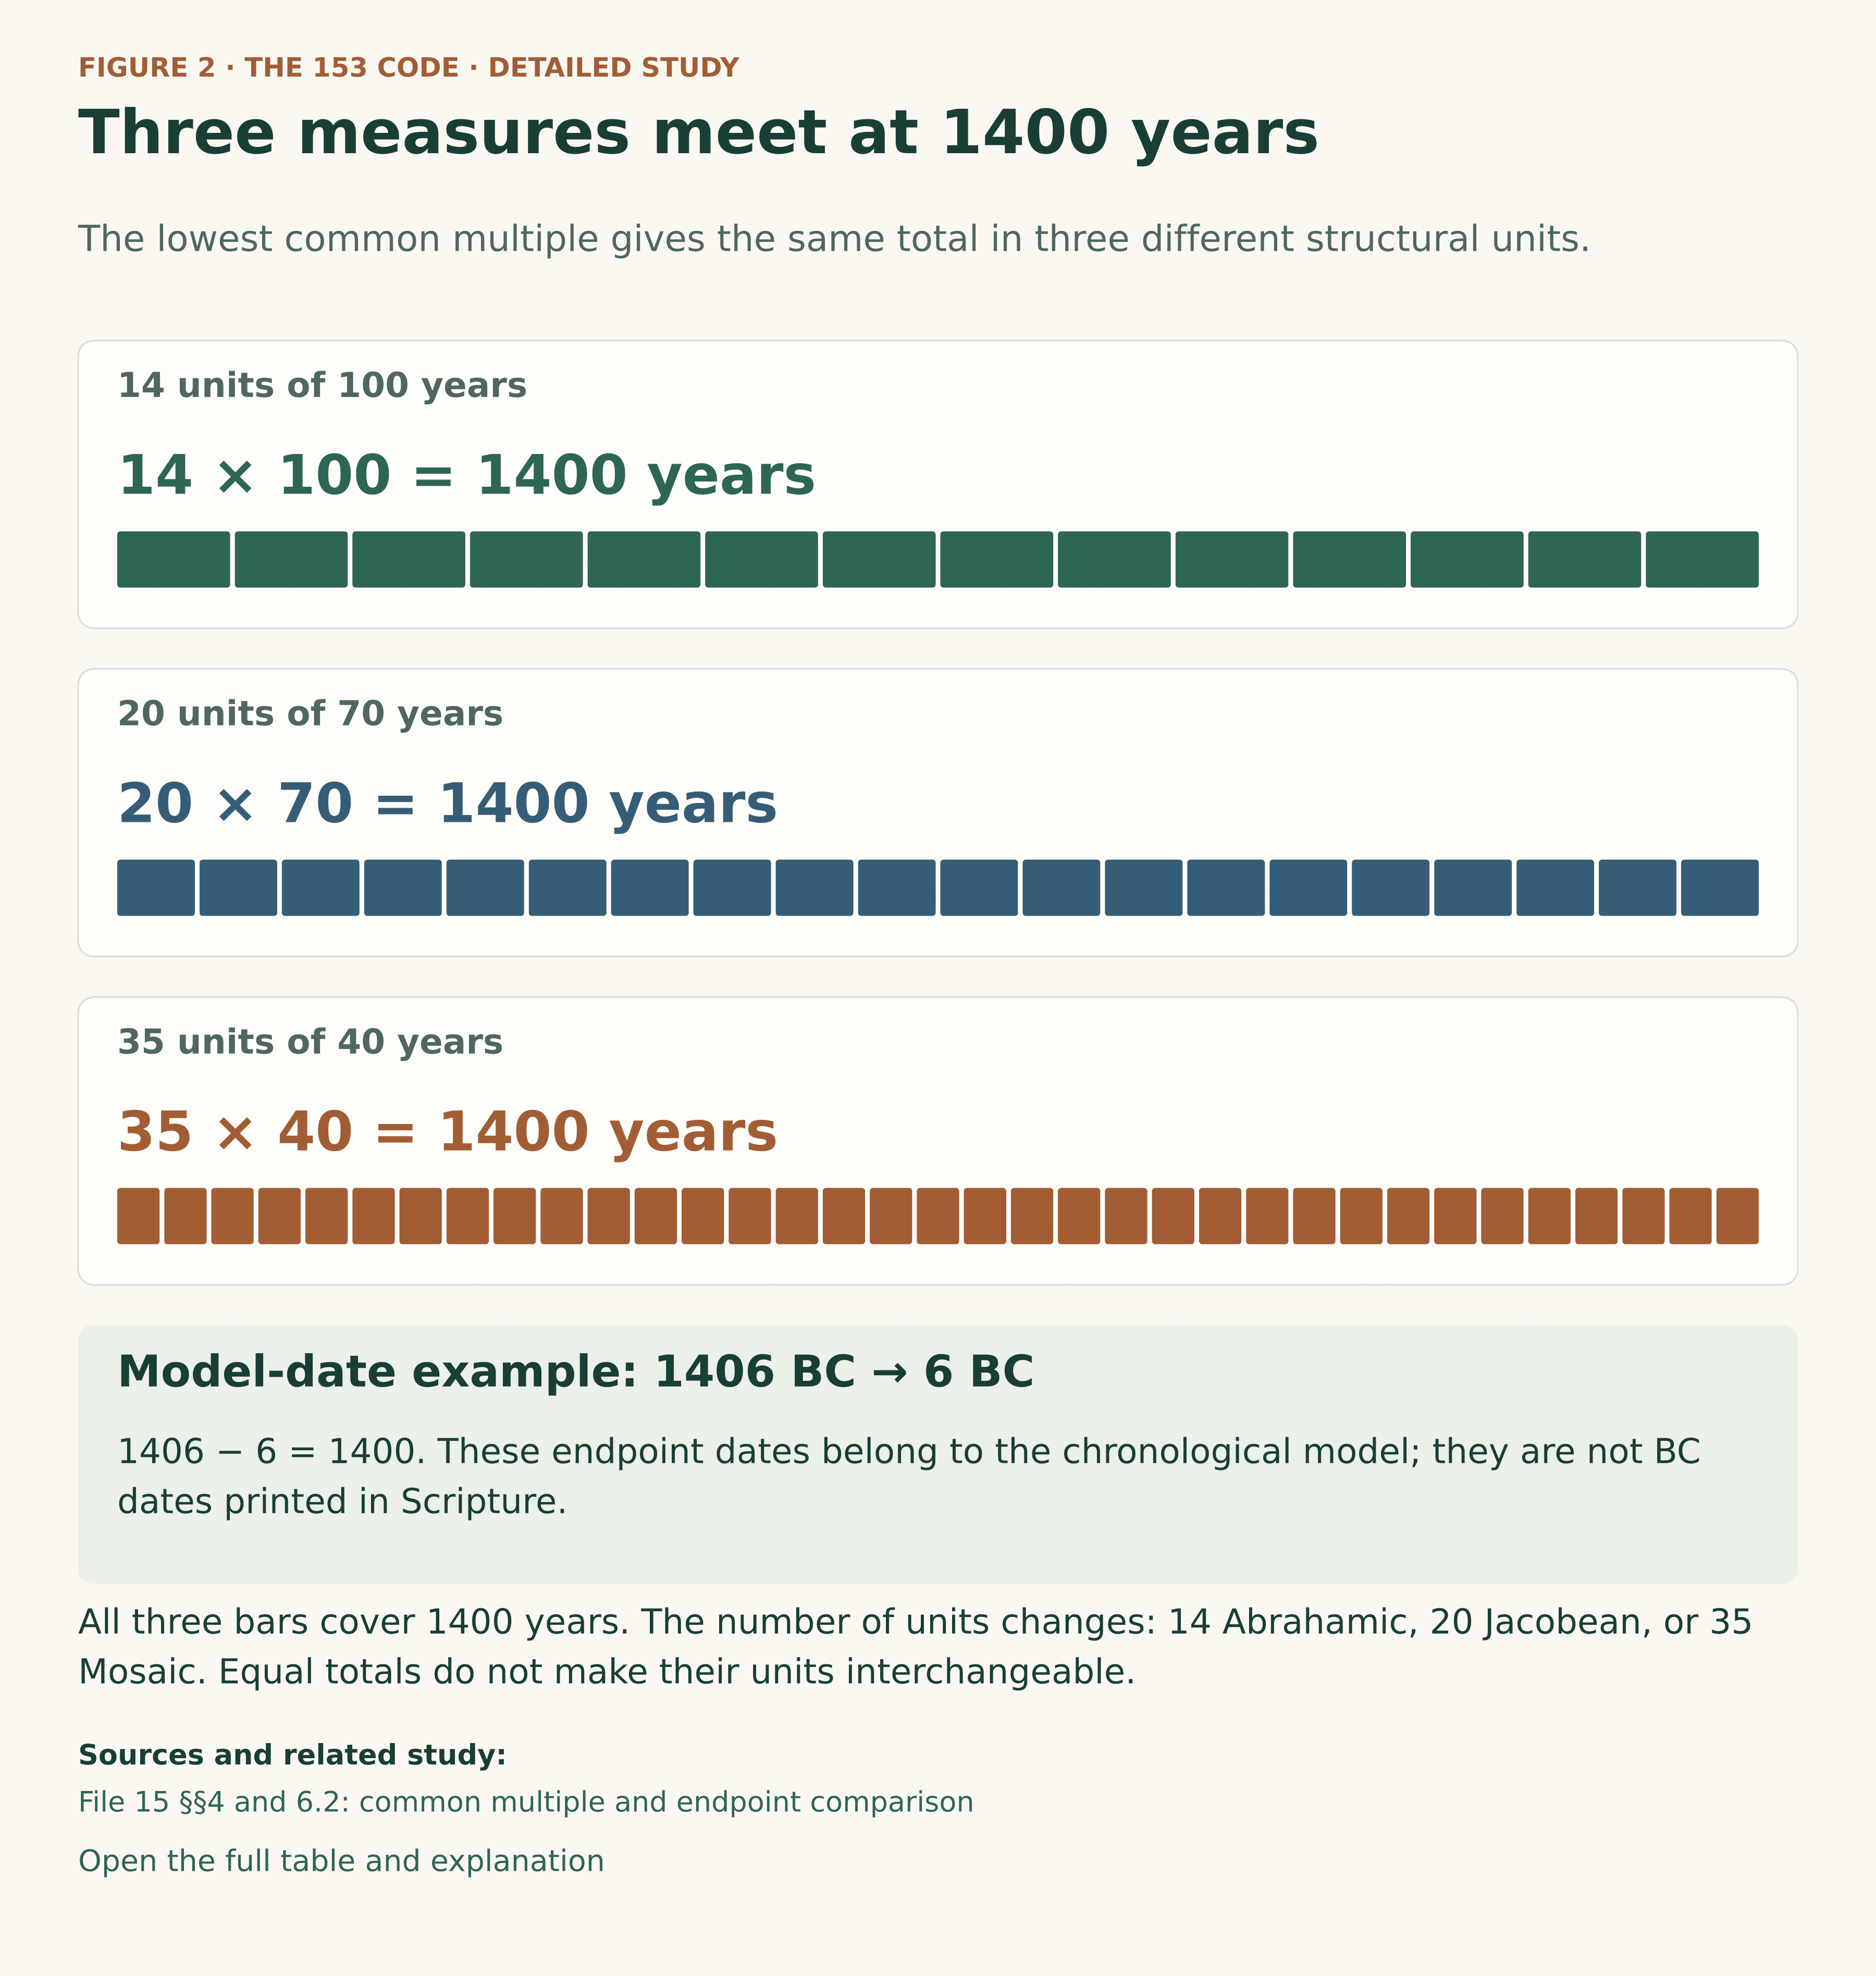
The three measures first meet at 1400 years. This is their least common multiple: the smallest positive span divisible into complete units of 40, 70 and 100 years.
The prime factors make the result transparent:
40 = 2³ × 5; 70 = 2 × 5 × 7; 100 = 2² × 5².
Taking the highest power of each prime required by the three numbers gives 2³ × 5² × 7 = 1400. The same total can therefore be measured in three ways.
Figure 2 · The 153 Code · Detailed Study
Three measures meet at 1400 years
The lowest common multiple gives the same total in three different structural units.
14 × 100 = 1400 years
14 units of 100 years
20 × 70 = 1400 years
20 units of 70 years
35 × 40 = 1400 years
35 units of 40 years
Sources: File 15 §§4 and 6.2: common multiple and endpoint comparison.
Model and calculation details
File 15 §§4 and 6.2 identifies 1400 as the lowest common multiple of 40, 70, and 100. The figure uses equal-length bars, divided into 14, 20, and 35 segments. Within the canonical chronological model, 1406 BC to 6 BC is a same-side span of 1400 years. The endpoint dates are reconstructed model dates, not dates printed in the biblical passages. Their arithmetic is separate from an identification of John’s 153 fish.

| Years per unit | Complete units | Common total |
|---|---|---|
| 100 | 14 | 14 × 100 = 1400 |
| 70 | 20 | 20 × 70 = 1400 |
| 40 | 35 | 35 × 40 = 1400 |
File 15 §4.2 applies this common scale to the repository’s regular chronological endpoints 1406 BC, the Conquest, and 6 BC, the birth of Christ: 1406 − 6 = 1400. These are the study’s chronological dates. Neither the BC labels nor the three-unit calculation is printed in John 21:11.
The value of the comparison is that one stated interval accommodates all three standards without a fractional remainder. That is an arithmetic fact. Its use as a complete generational cycle is the structural interpretation given to that fact in File 15.
The separate cumulative comparison
File 15 also gives a tenfold comparison: 14006 BC → 6 BC = 14000 years = 10 × 1400. File 18 identifies 14006 BC more precisely as an actual MT cumulative Adam Year-6 coordinate, the center on its Moses/Nisan line. The coordinate belongs to a cumulative framework that adds lifespans; it is not the regular Creation date.
Accordingly, 14000 = 140 × 100 = 200 × 70 = 350 × 40 is a separate application of the same units. The arithmetic does not turn the regular Conquest-to-Christ interval into a 14000-year historical span. Readers needing that distinction can consult Cumulative Biblical Chronology: Adding the Lifespans. The shared-center argument below does not depend on this cumulative extension.
4. Abraham: two spans can share the same years
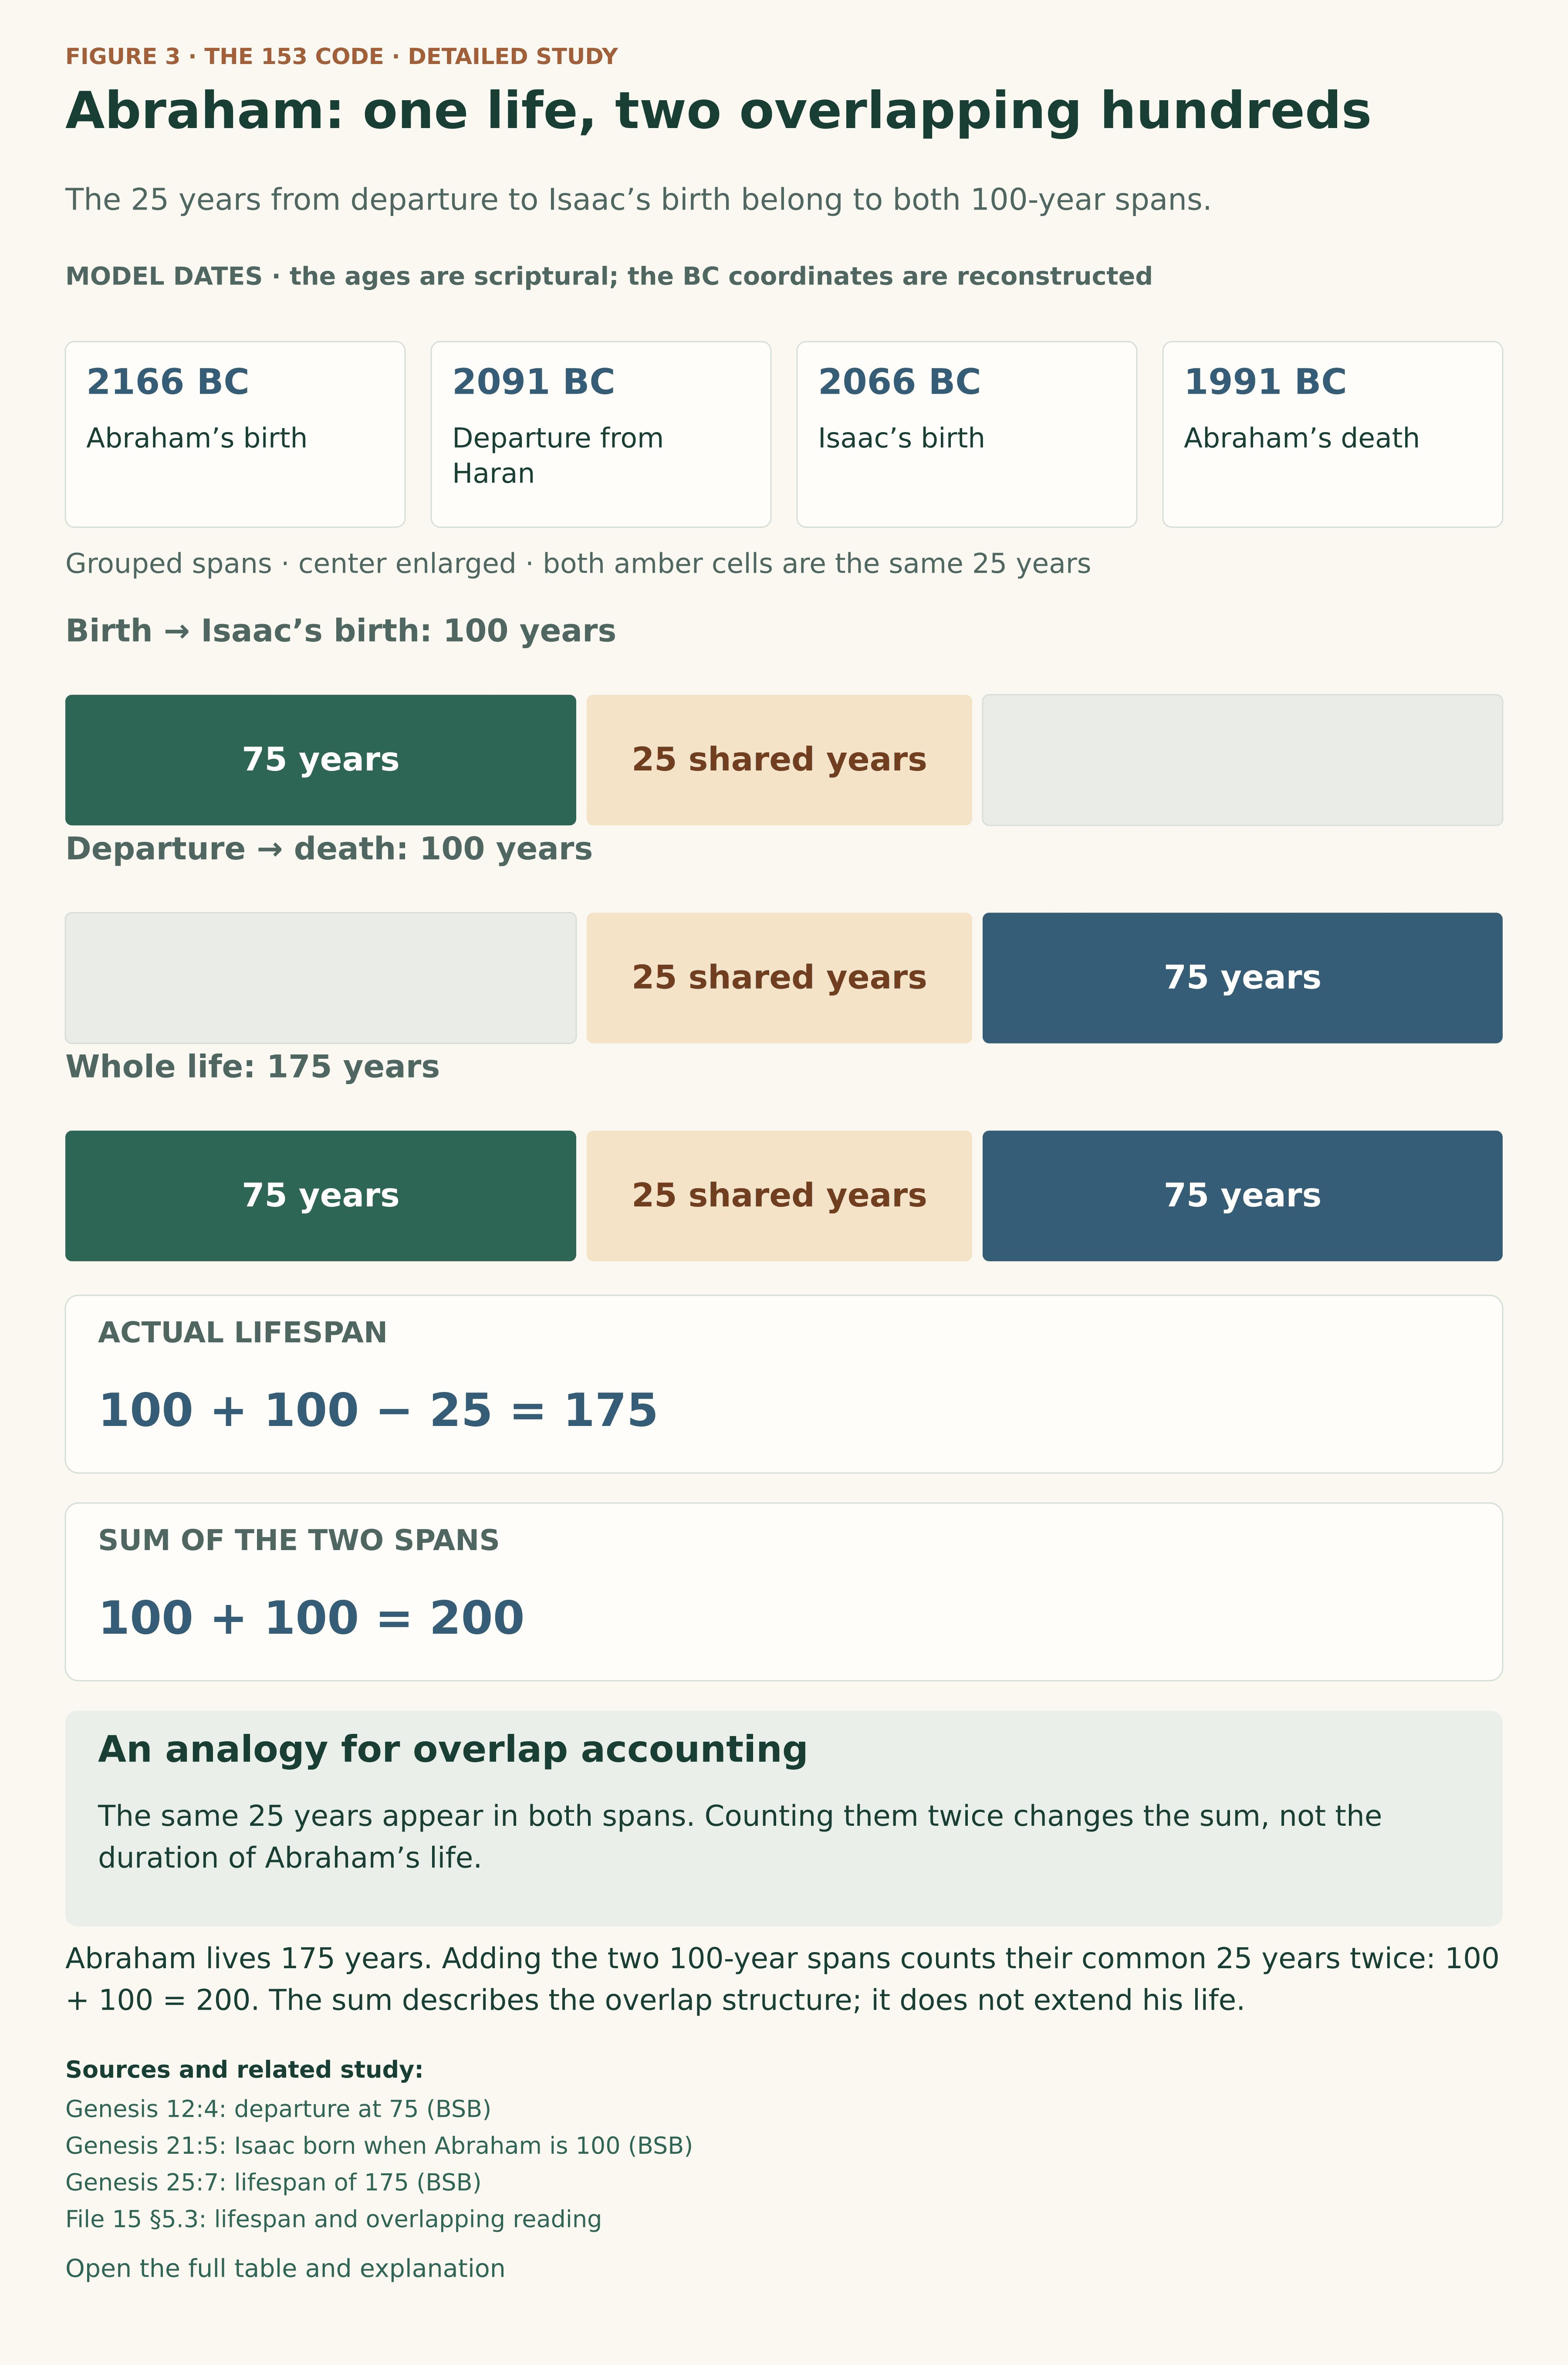
Before combining long sequences of generations, it helps to examine a single life. File 15 §5.3 presents Abraham’s lifespan as 75 + 25 + 75 = 175 years. The first division is his departure from Haran at 75; the second is Isaac’s birth when Abraham is 100, as stated in Genesis 21:5.
| Event | Repository date | Abraham’s age | Source of age / chronology |
|---|---|---|---|
| Abraham born | 2166 BC | 0 | File 15 §5.3 / repository chronology |
| Departure from Haran | 2091 BC | 75 | Genesis 12:4 (BSB) |
| Isaac born | 2066 BC | 100 | Genesis 21:5 (BSB) |
| Abraham dies | 1991 BC | 175 | Genesis 25:7 (BSB) |
The BC labels are supplied by the repository chronology; the linked biblical passages supply the stated ages. Two 100-year spans can now be identified. Abraham’s birth to Isaac’s birth covers 2166 − 2066 = 100 years. Abraham’s departure from Haran to his death covers 2091 − 1991 = 100 years. Both spans include the 25 years from the departure to Isaac’s birth.
Figure 3 · The 153 Code · Detailed Study
Abraham: one life, two overlapping hundreds
The 25 years from departure to Isaac’s birth belong to both 100-year spans.
BC dates belong to the chronological model. The ages 75, 100, and 175 are explicit in Genesis.
Birth → Isaac’s birth: 100 years
Departure → death: 100 years
Whole life: 175 years
Grouped spans; center enlarged. Both amber cells represent the same 25 years.
100 + 100 − 25 = 175
100 + 100 = 200
Sources: Genesis 12:4: departure at 75 (BSB) · Genesis 21:5: Isaac born when Abraham is 100 (BSB) · Genesis 25:7: lifespan of 175 (BSB) · File 15 §5.3: lifespan and overlapping reading.
Model and calculation details
Genesis 12:4 gives age 75 at departure from Haran; Genesis 21:5 gives age 100 at Isaac’s birth; Genesis 25:7 gives a lifespan of 175. These inputs divide Abraham’s life into 75 + 25 + 75 years. File 15 §5.3 distinguishes the 175-year lifespan from the chiastic total 100 + 100 = 200. The dates 2166, 2091, 2066, and 1991 BC are the canonical model’s coordinates. This provides an analogy for overlap accounting, not a claim that John 21 directly supplies Abraham’s chronology.

Adding the two component lengths gives 100 + 100 = 200. Measuring their combined extent requires subtracting the overlap once:
100 + 100 − 25 = 175.
Abraham has not acquired a 200-year lifespan. The sum of the component lengths counts the common 25 years twice, whereas his actual lifespan includes those years once. Both calculations are valid because they answer different questions.
This supplies a concrete analogy for the later 153 + 1 relationship. In that construction, two sequences share a 70-year central block. The distinction between combined extent and summed component lengths is the same. The analogy explains the accounting; it does not establish by itself that John’s fish represent generations.
5. Names, occupied positions and intervals
The 70-year construction uses a selected inventory for Luke’s genealogy. A counted inventory must be identified before it can support a chronology, because textual variants and endpoint choices affect the result.
File 43 §3.4 arranges 76 human entries from Adam to Jesus. It places a figurative God bookend before Adam, making 77 occupied positions in the full schematic display. Repeated names occupy separate positions; this is not a count of unique personal names. The divine bookend reflects the genealogy’s theological reach to God, without assigning God a finite human lifespan.
The selected inventory also needs an edition qualification. In ancestor-to-descendant order, File 43 uses Hezron → Ram → Amminadab. The BSB wording of Luke 3:33 instead gives Hezron → Arni → Admin → Amminadab in that same direction. Counting the entire BSB list with Jesus and God included gives 78 entries. Thus the model’s 77-position inventory is not a transcription of the BSB edition quoted at the opening of this article.
| Inventory | Occupied positions | Successive intervals | Counting basis |
|---|---|---|---|
| Selected human entries, Adam → Jesus | 76 | 75 | File 43 selected inventory; one Ram position. |
| Selected bookend plus human entries, God → Jesus | 77 | 76 | Figurative God bookend included; repeated names remain separate positions. |
| BSB printed list, Jesus → God | 78 | 77 | Includes both Arni and Admin where the selected inventory has Ram. |
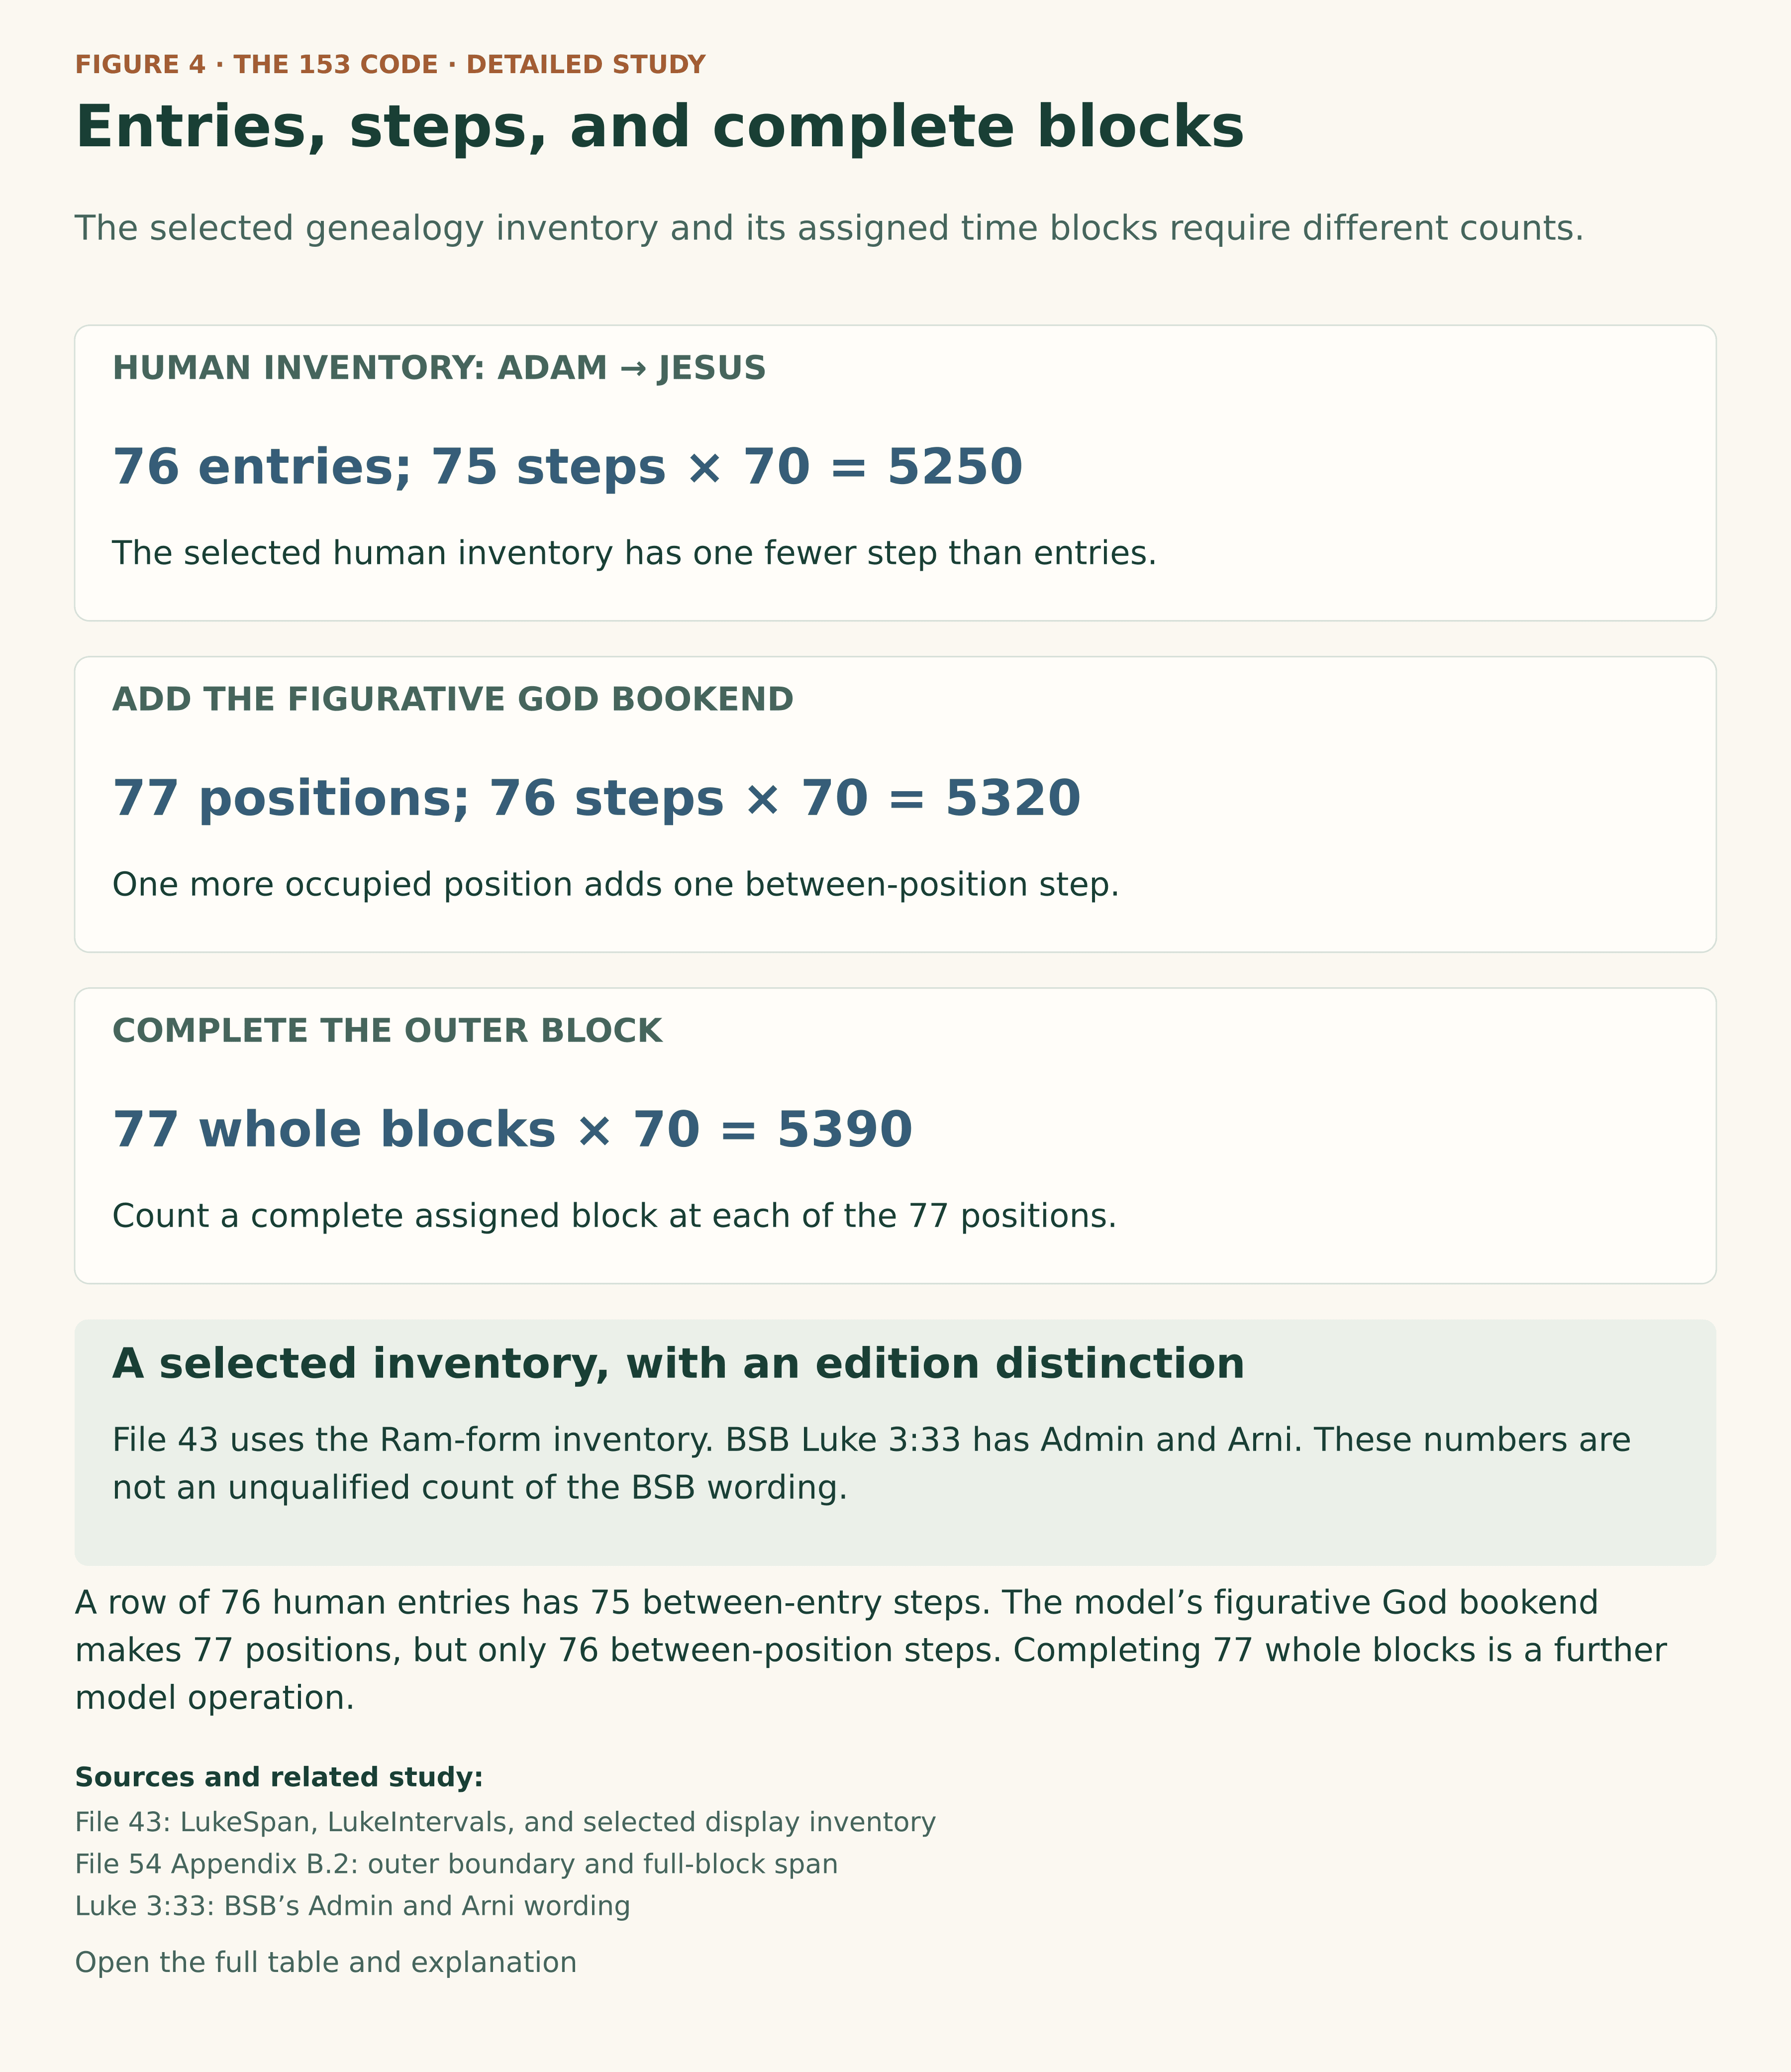
A further distinction concerns the spaces between positions. A sequence of 76 human entries has 75 successive intervals from its first entry to its last. Add the figurative God position, and 77 positions have 76 intervals between their corresponding boundaries. If the model assigns a complete 70-year block to every position, measuring through the end of the final block yields 77 blocks.
Figure 4 · The 153 Code · Detailed Study
Entries, steps, and complete blocks
The selected genealogy inventory and its assigned time blocks require different counts.
Adam through Jesus in the selected inventory.
75 steps × 70 = 5250
One more occupied position adds one between-position step.
76 steps × 70 = 5320
Count the full assigned block at each of the 77 positions.
77 × 70 = 5390
Sources: File 43: LukeSpan, LukeIntervals, and selected display inventory · File 54 Appendix B.2: outer boundary and full-block span · Luke 3:33: BSB’s Admin and Arni wording.
Model and calculation details
File 43 uses a selected Ram-form genealogy inventory: 76 human entries from Adam through Jesus, yielding 75 adjacent intervals. Adding the figurative God bookend produces 77 occupied positions and 76 between-position intervals. Assigning 77 complete 70-year blocks produces 5390 years, including an outer boundary. These distinctions prevent substituting a count of names for a count of intervals or complete blocks. The BSB edition of Luke 3:33 reads Admin and Arni; the selected inventory must not be presented as an unqualified BSB name count.

The following table preserves the selected File 43 inventory in its source order, from God toward Jesus. It distinguishes the block position from the human-entry position. The source’s additional display row labeled Final generation, beyond Jesus’ block, is excluded from this 77-position count.
Open the complete selected inventory: 77 positions, including 76 human entries
| Block position | Human-entry position | Selected File 43 name |
|---|---|---|
| 1 | — | God |
| 2 | 1 | Adam |
| 3 | 2 | Seth |
| 4 | 3 | Enosh |
| 5 | 4 | Kenan |
| 6 | 5 | Mahalalel |
| 7 | 6 | Jared |
| 8 | 7 | Enoch |
| 9 | 8 | Methuselah |
| 10 | 9 | Lamech |
| 11 | 10 | Noah |
| 12 | 11 | Shem |
| 13 | 12 | Arphaxad |
| 14 | 13 | Cainan (second) |
| 15 | 14 | Shelah |
| 16 | 15 | Eber |
| 17 | 16 | Peleg |
| 18 | 17 | Reu |
| 19 | 18 | Serug |
| 20 | 19 | Nahor |
| 21 | 20 | Terah |
| 22 | 21 | Abraham |
| 23 | 22 | Isaac |
| 24 | 23 | Jacob |
| 25 | 24 | Judah |
| 26 | 25 | Perez |
| 27 | 26 | Hezron |
| 28 | 27 | Ram |
| 29 | 28 | Amminadab |
| 30 | 29 | Nahshon |
| 31 | 30 | Salmon |
| 32 | 31 | Boaz |
| 33 | 32 | Obed |
| 34 | 33 | Jesse |
| 35 | 34 | David |
| 36 | 35 | Nathan |
| 37 | 36 | Mattatha |
| 38 | 37 | Menna |
| 39 | 38 | Melea |
| 40 | 39 | Eliakim |
| 41 | 40 | Jonam |
| 42 | 41 | Joseph |
| 43 | 42 | Judah |
| 44 | 43 | Simeon |
| 45 | 44 | Levi |
| 46 | 45 | Matthat |
| 47 | 46 | Jorim |
| 48 | 47 | Eliezer |
| 49 | 48 | Joshua |
| 50 | 49 | Er |
| 51 | 50 | Elmadam |
| 52 | 51 | Cosam |
| 53 | 52 | Addi |
| 54 | 53 | Melki |
| 55 | 54 | Neri |
| 56 | 55 | Shealtiel |
| 57 | 56 | Zerubbabel |
| 58 | 57 | Rhesa |
| 59 | 58 | Joanan |
| 60 | 59 | Joda |
| 61 | 60 | Josech |
| 62 | 61 | Semein |
| 63 | 62 | Mattathias |
| 64 | 63 | Maath |
| 65 | 64 | Naggai |
| 66 | 65 | Esli |
| 67 | 66 | Nahum |
| 68 | 67 | Amos |
| 69 | 68 | Mattathias |
| 70 | 69 | Joseph |
| 71 | 70 | Jannai |
| 72 | 71 | Melki |
| 73 | 72 | Levi |
| 74 | 73 | Matthat |
| 75 | 74 | Heli |
| 76 | 75 | Joseph |
| 77 | 76 | Jesus |
Download the complete selected-inventory CSV, which also preserves the source’s displayed block labels for reference. Those schematic labels are not historical birth-and-death dates for each ancestor. Luke 3:23–38 in BSB remains separately linked for direct comparison with the printed Scripture text.
6. Two alignments of the same schematic sequence
Files 43 and 54 place the 70-year blocks in two related alignments. The primary alignment begins the Jesus-associated block at 6 BC and ends it at AD 65. The alternate alignment shifts the same framework 30 years earlier, giving a central block from 36 BC to AD 35. The alternate starting boundary is not a proposed historical birth date for Jesus.
The sources sometimes call these alignments rails. The term refers to the placement of the schematic sequence. It does not make the alternate dates interchangeable with the primary ones.
| Alignment | Outer bookend starts | Adam block starts | Jesus-associated block | Full outer extent |
|---|---|---|---|---|
| 6 BC alignment | 5326 BC | 5256 BC | 6 BC → AD 65 | 5390 = 77 × 70 |
| 36 BC alignment | 5356 BC | 5286 BC | 36 BC → AD 35 | 5390 = 77 × 70 |
Starting with the 76 selected human entries, there are 75 intervals of 70 years between their initial boundaries: 75 × 70 = 5250. For the 6 BC alignment, the Adam boundary is therefore 6 + 5250 = 5256 BC. For the 36 BC alignment, it is 36 + 5250 = 5286 BC.
The figurative God bookend begins one further 70-year block earlier. The two outer boundaries are consequently 5256 + 70 = 5326 BC and 5286 + 70 = 5356 BC. These values are inherited from the defined genealogy model before the comparison with the fish count is made.
The same distinction explains the 76- and 77-block measurements preserved in File 69 §1.8. In the primary alignment, 5326 BC → 6 BC = 5320 = 76 × 70 compares corresponding initial boundaries. Extending through the complete Jesus-associated block gives 5326 BC → AD 65 = 5390 = 77 × 70. The extra 70 results from moving the ending boundary; it is not a free adjustment to an unchanged span.
The alternate alignment has the same lengths: 5356 − 36 = 5320, and 5356 + 35 − 1 = 5390. File 54 Appendix B.2 expressly selects this 36 BC alignment for the 153-block Mirror comparison. The civil BC/AD calculation used in the latter equation is explained in §9.
7. The three products of 153
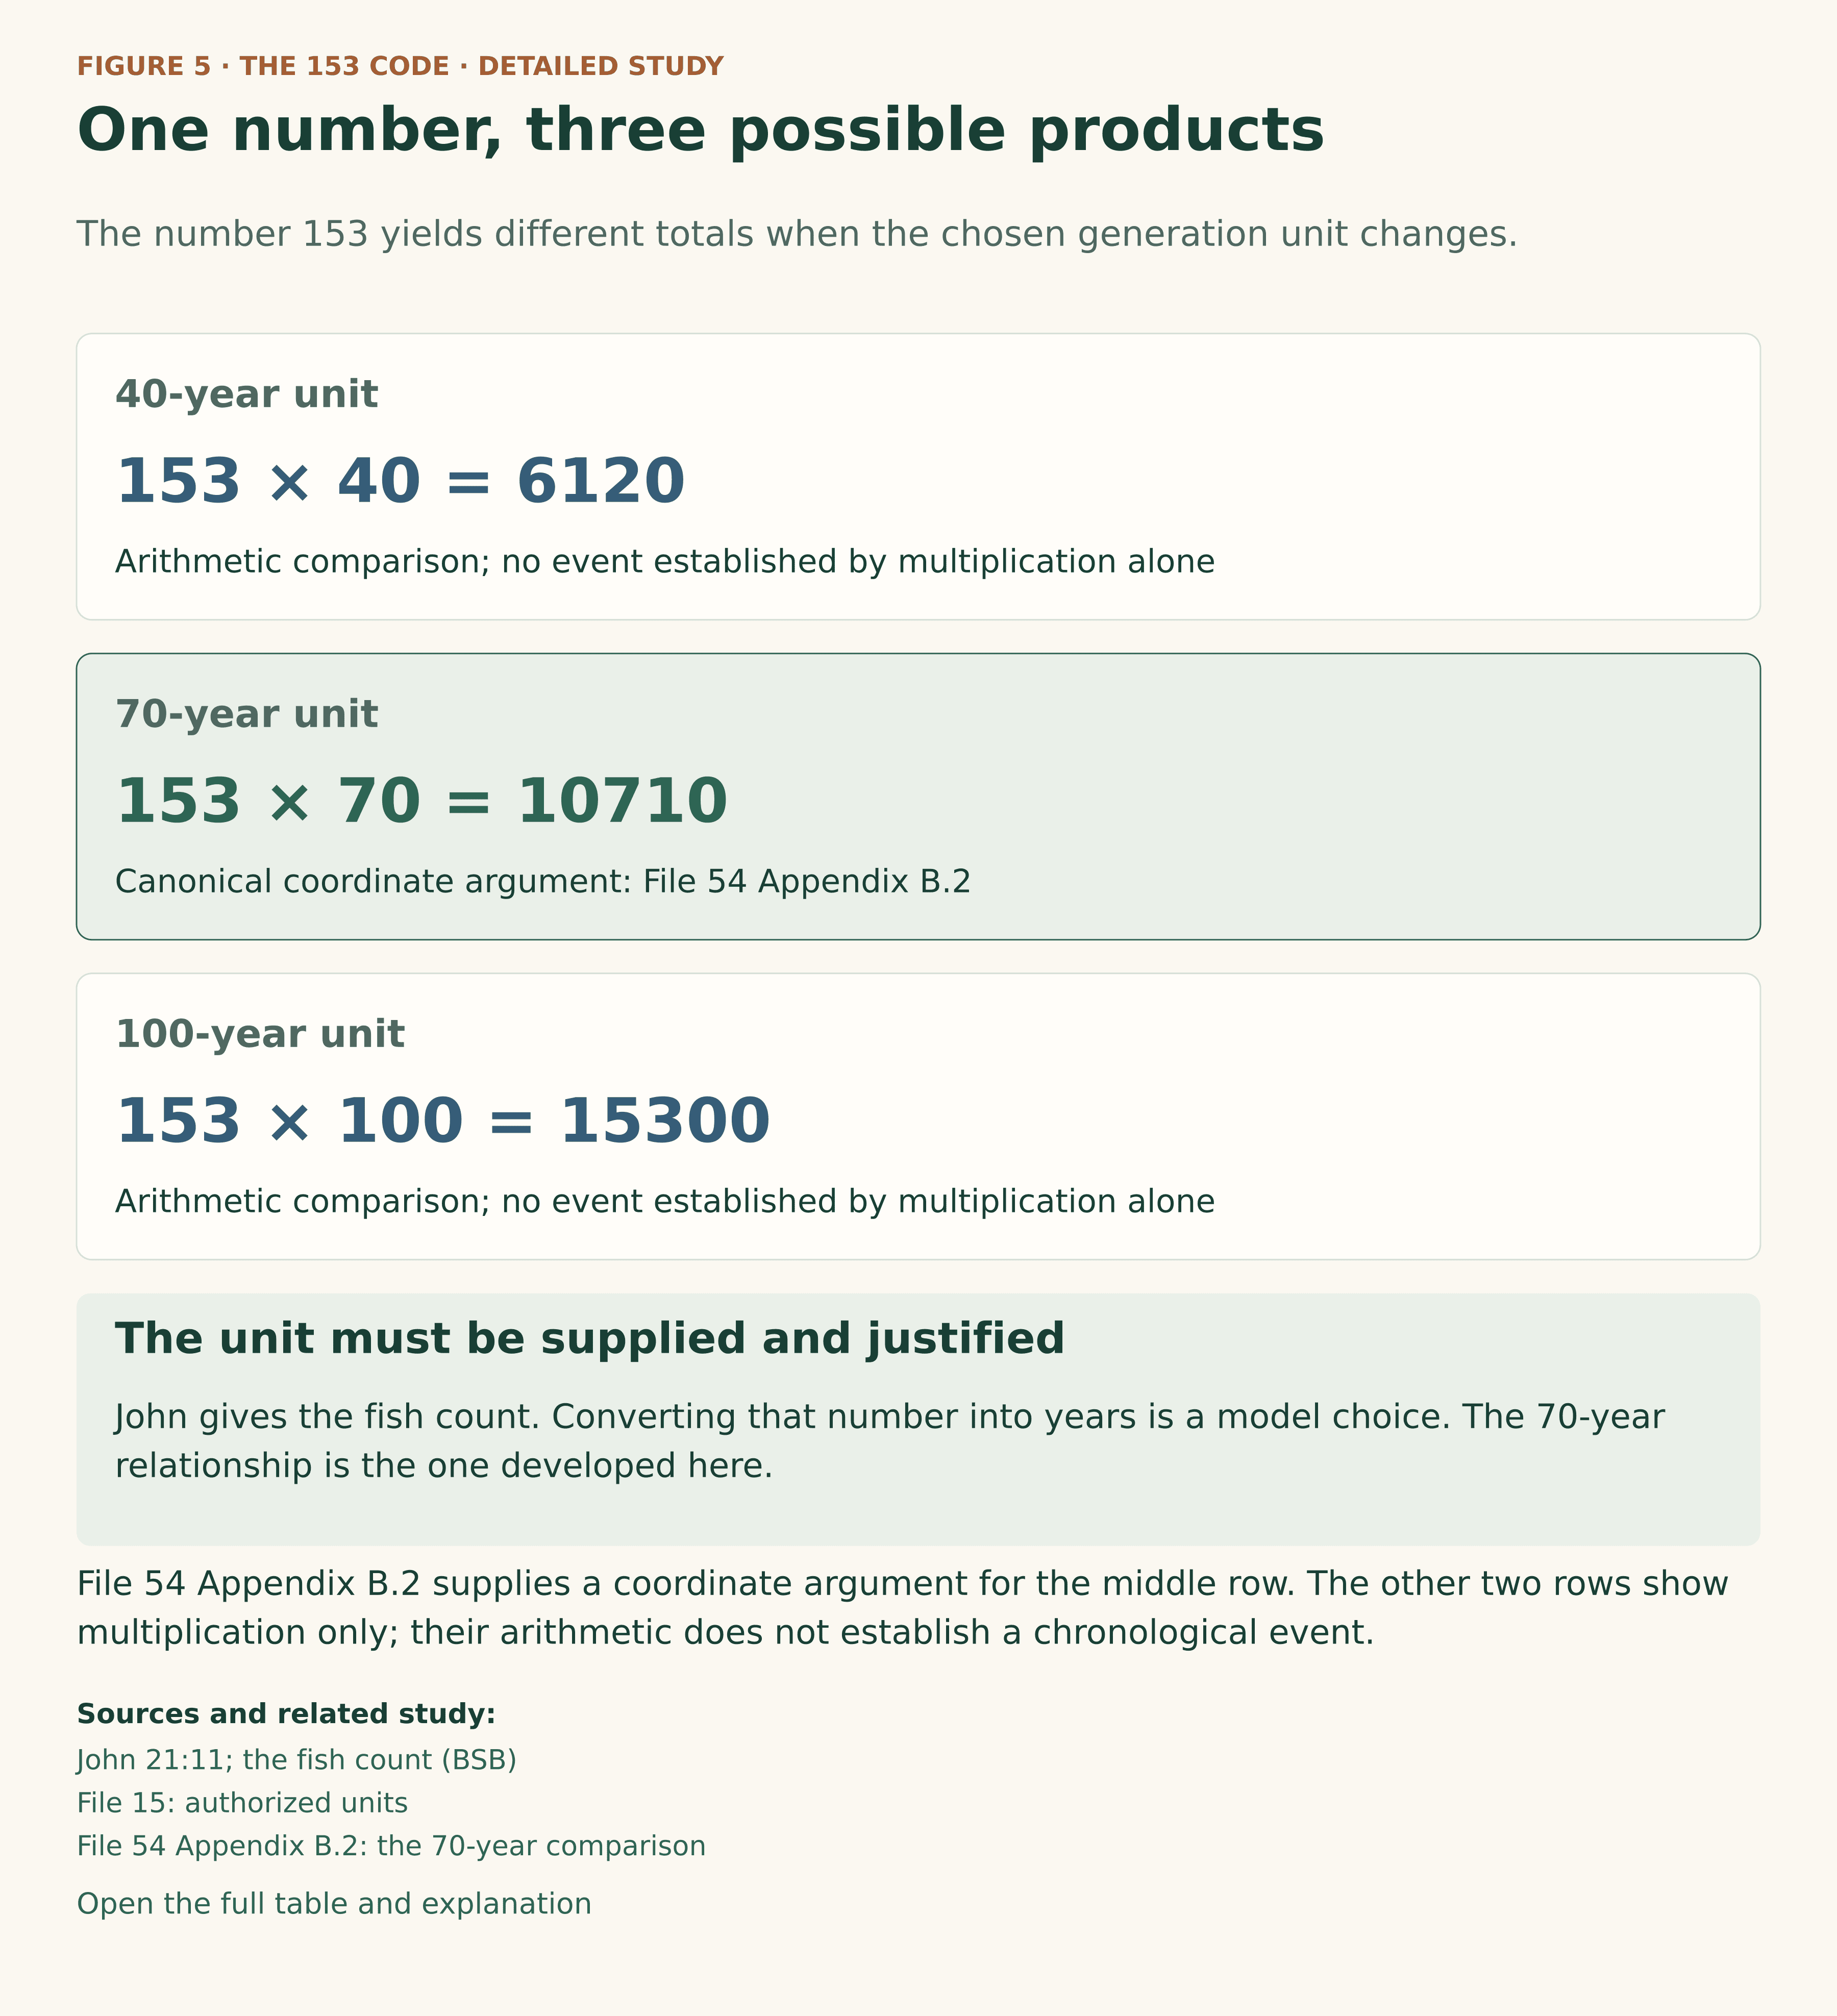
With the generation unit stated, multiplying the fish count produces three possible lengths:
Figure 5 · The 153 Code · Detailed Study
One number, three possible products
The number 153 yields different totals when the chosen generation unit changes.
= 6120
= 10710
= 15300
Sources: John 21:11; the fish count (BSB) · File 15: authorized units · File 54 Appendix B.2: the 70-year comparison.
Model and calculation details
John 21:11 supplies the count of 153 fish, not a unit of years. Applying a 40-, 70-, or 100-year unit is a further model choice. The 70-year product has a specific canonical coordinate relationship in File 54 Appendix B.2. Neither the three products nor their exactness proves that John intended a generational code.

| Years per block | Calculation | Total years | Use here |
|---|---|---|---|
| 40 | 153 × 40 | 6120 | Arithmetic comparison of scales; no independent chronology established here. |
| 70 | 153 × 70 | 10710 | Selected for the shared-center comparison in File 54 Appendix B.2. |
| 100 | 153 × 100 | 15300 | Arithmetic comparison of scales; no independent chronology established here. |
These products reproduce the compact mathematical starting point of the earlier 153 discussion. They do not by themselves identify a starting year, a finishing year or a historical event. A chronology requires those additional definitions.
The 70-year product has a specific role here because File 54’s outer-boundary comparison produces 10710 years, exactly 153 × 70. The 40-year and 100-year products remain useful comparisons of scale. Their arithmetic is preserved without treating them as separately demonstrated orbital chronologies.
The next step is to trace the 70-year case through both component sequences and their common center.
8. The shared central generation
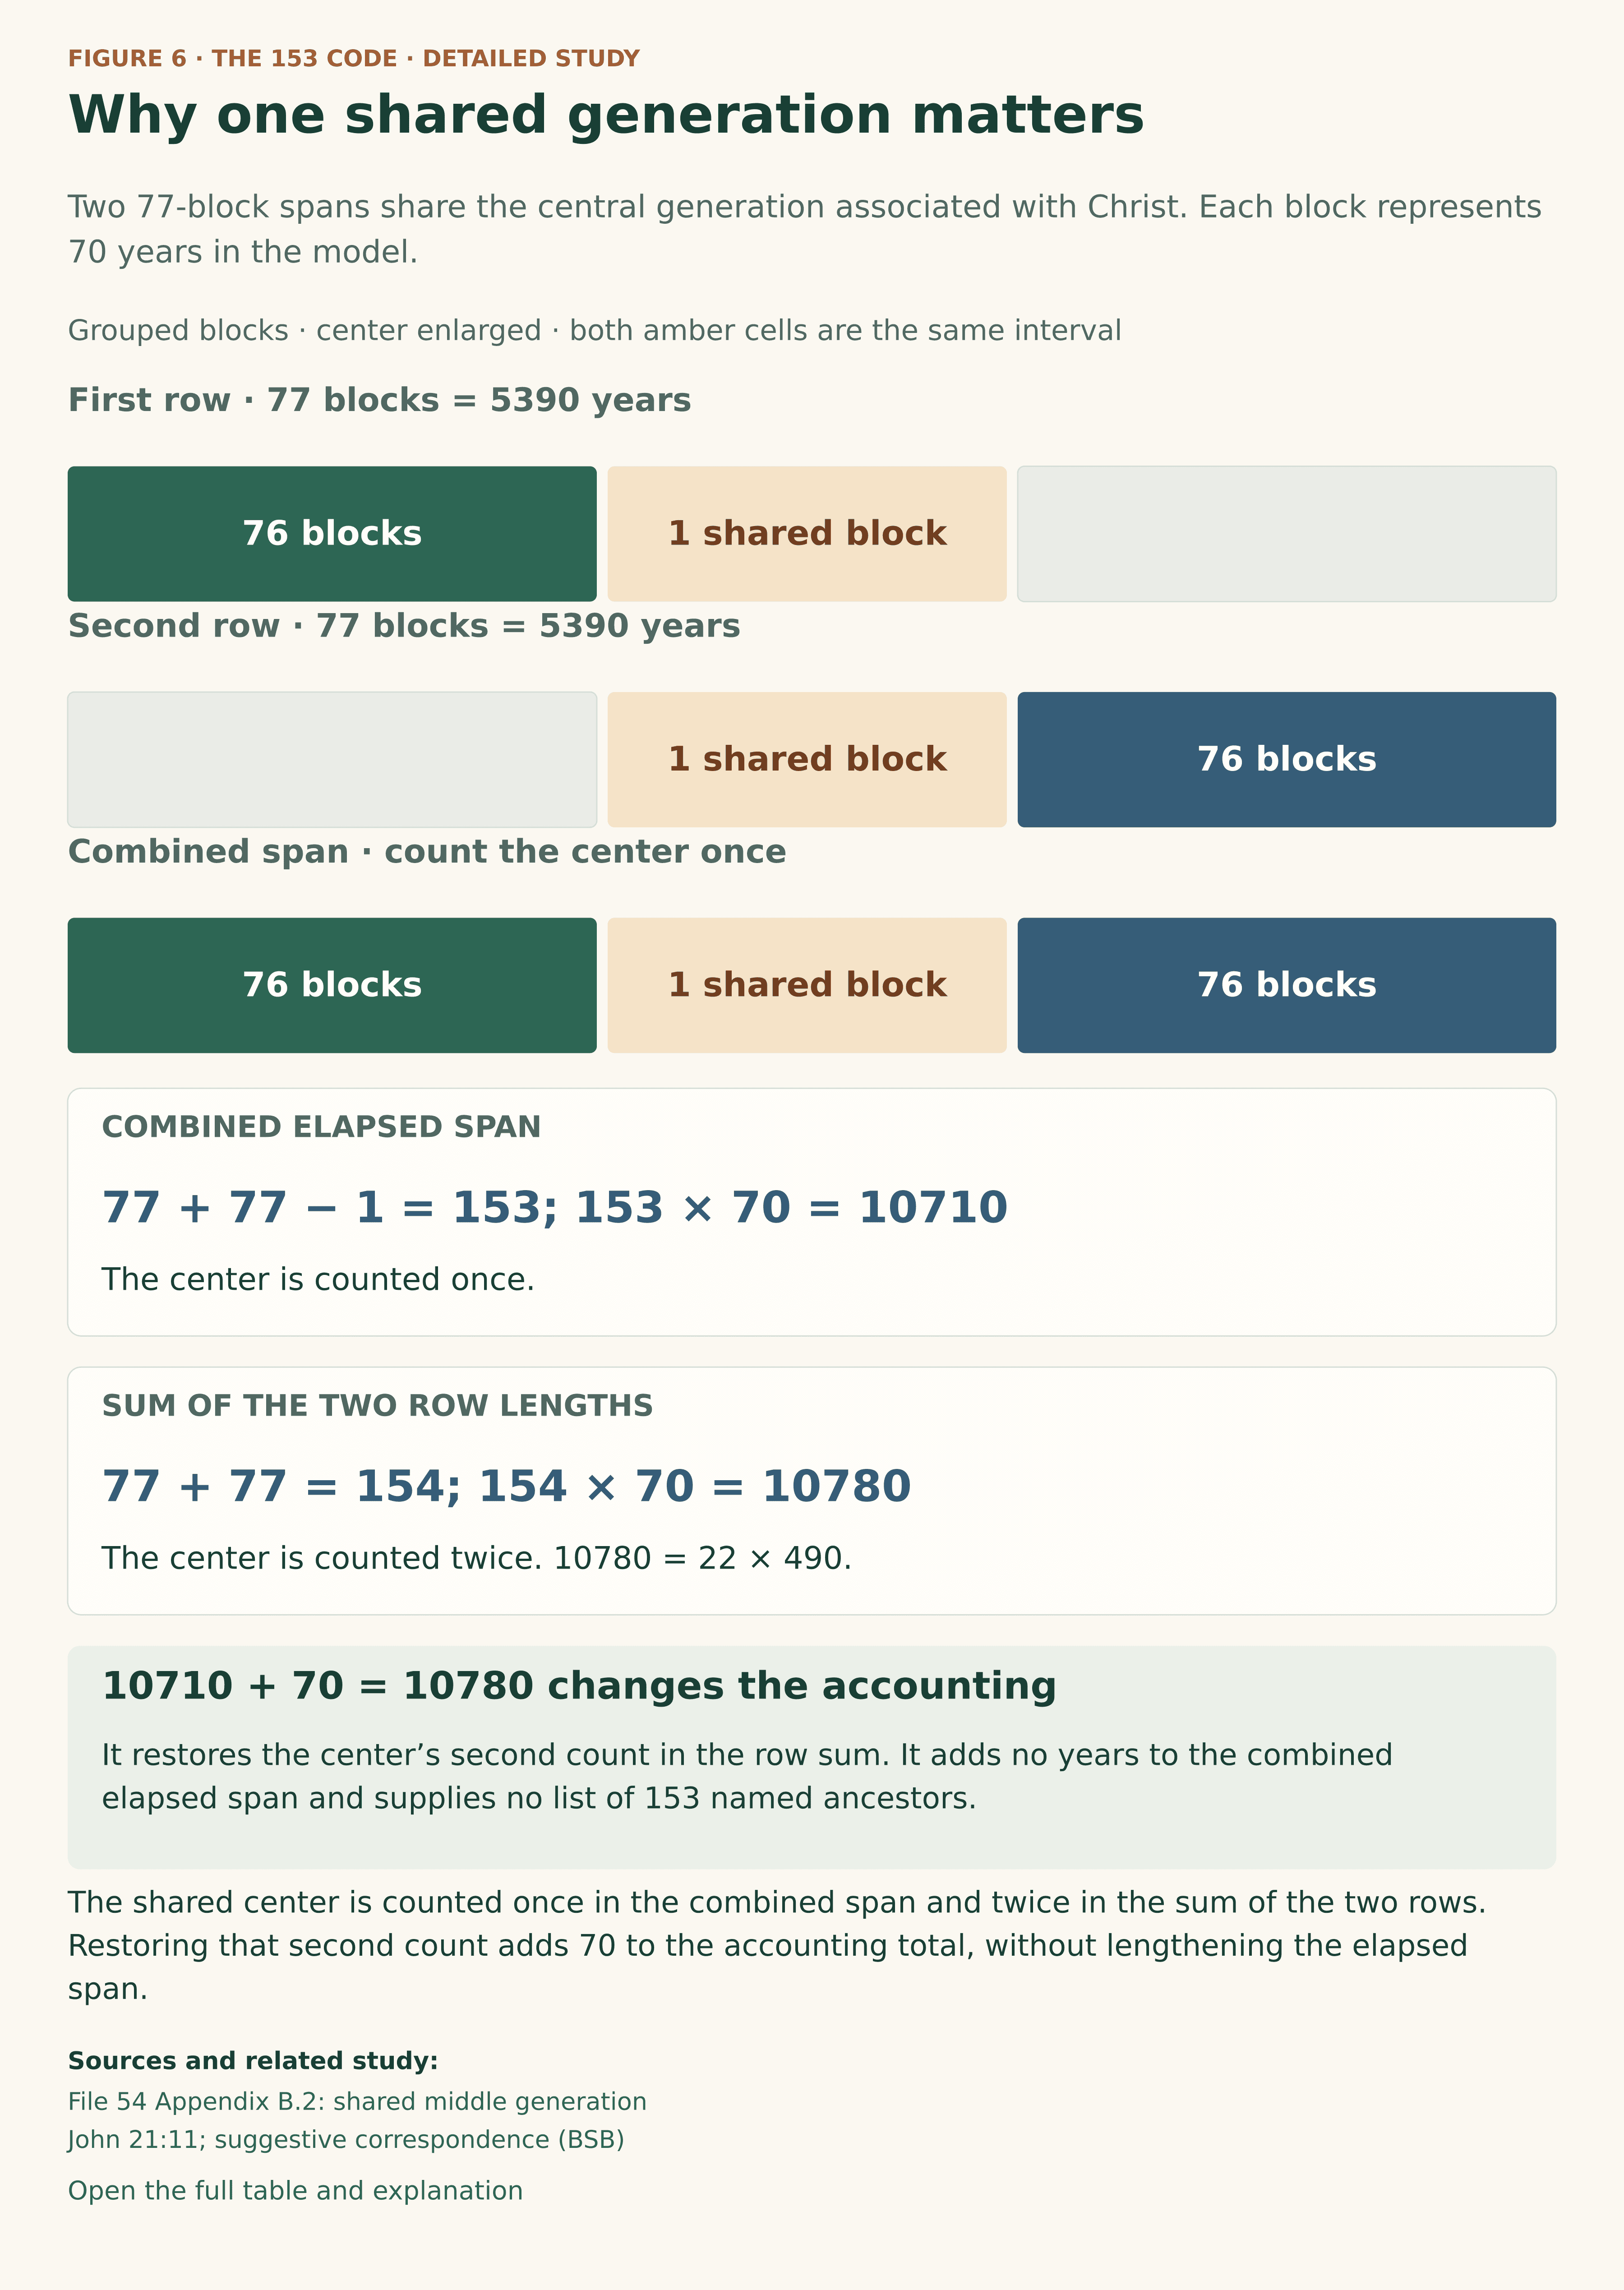
The central illustration combines two schematic sequences, each 77 blocks long. The last block of the first sequence is also the first block of the second. File 54 associates that shared central generation with Christ.
Count the distinct occupied blocks from one outer end to the other:
76 + 1 + 76 = 153.
Or begin with the two sequence lengths and remove the duplicate count:
77 + 77 − 1 = 153.
Since each block represents 70 years, the combined extent is 153 × 70 = 10710 years.
Figure 6 · The 153 Code · Detailed Study
Why one shared generation matters
Two 77-block spans share the central generation associated with Christ. Each block represents 70 years in the model.
Grouped blocks; center enlarged for readability. Both amber cells represent the same interval.
First row · 77 blocks
Second row · 77 blocks
Combined span · count the center once
77 + 77 − 1 = 153
153 × 70 = 10710
The center is counted once.
77 + 77 = 154
154 × 70 = 10780
10780 = 22 × 490
The center is counted twice.
Sources: File 54 Appendix B.2: shared middle generation · John 21:11; suggestive correspondence (BSB).
Model and calculation details
Each row contains 76 outer blocks and the shared central block: 77 × 70 = 5390. Their union is 76 + 1 + 76 = 153 blocks, or 10710 elapsed years. Adding the two row lengths counts the center twice: 77 + 77 = 154 blocks, or 10780 = 22 × 490. These are schematic blocks, not a count of 153 named ancestors. The relation to John’s fish is suggestive theological correspondence, not proof of authorial dependence.

Now count each sequence separately. Both have 77 blocks, and therefore both have a length of 77 × 70 = 5390 years. Adding those lengths gives 5390 + 5390 = 10780, equivalent to 154 × 70. The common center appears once in each component of that sum.
| Count | Block calculation | Blocks | Years at 70 per block | Meaning |
|---|---|---|---|---|
| First sequence | 76 + 1 = 77 | 77 | 5390 | Left outer blocks and the common center. |
| Second sequence | 1 + 76 = 77 | 77 | 5390 | The common center and right outer blocks. |
| Common center | 1 × 70 | 1 | 70 | The same block belongs to both sequences. |
| Combined extent | 77 + 77 − 1 = 153 | 153 | 10710 | Shared center counted once. |
| Sum of sequence lengths | 77 + 77 = 154 | 154 | 10780 | Shared center counted in each component; aggregate, not extra elapsed time. |
This explains File 54’s addition of the shared 70-year generation:
10710 + 70 = 10780.
The operation restores the center’s second count in the component total. It does not extend the elapsed outer span, add a missing ancestor to Luke or alter a person’s lifespan. Abraham’s overlapping 100-year spans illustrated the same distinction on a smaller scale: 200 was the aggregate of two lengths, while 175 was their combined extent.
The two-strip diagram is an explanatory reconstruction of the source’s shared-center calculation. It is not a claim that either Gospel prints two lists of 77 people, or that John identifies an individual ancestor with each fish. The exact coordinates show how the reconstruction follows the selected canonical model.
9. The exact Mirror coordinates
File 54 Appendix B.2 begins with the alternate outer boundary 5356 BC and applies its Protocol 1 Mirror rule. The strict target for that single boundary is AD 5355. The shared central generation runs from 36 BC to AD 35.
There are two operations to keep distinct: obtaining the reflected date and calculating the elapsed span between two civil dates.
Reflecting this single date
In astronomical year numbering, 1 BC is year 0, 2 BC is year −1, and 5356 BC is year −5355. Reflecting that integer around astronomical year 0 changes its sign, giving +5355, or AD 5355. For the single-date state used here, this gives the source’s strict Protocol 1 target.
This explanation is deliberately limited to the selected single boundary. Files 00 §3.9 and 09 Appendix A distinguish that operation from the treatment of exact numeric-year displays and paired seasonal dates. Their other conventions must not be substituted into the present calculation midway through it.
Measuring the civil span
Ordinary BC/AD labels have no year zero: 1 BC is followed by AD 1. Consequently, a cross-era elapsed span uses BC year + AD year − 1. For the outer boundaries:
5356 + 5355 − 1 = 10710 = 153 × 70.
For the center:
36 + 35 − 1 = 70.
The two component lengths can now be verified separately.
| Component | Schematic boundaries | Civil span calculation | Years | 70-year blocks |
|---|---|---|---|---|
| First sequence | 5356 BC → AD 35 | 5356 + 35 − 1 | 5390 | 77 |
| Second sequence | 36 BC → AD 5355 | 36 + 5355 − 1 | 5390 | 77 |
| Shared center | 36 BC → AD 35 | 36 + 35 − 1 | 70 | 1 |
| Combined extent | 5356 BC → AD 5355 | 5356 + 5355 − 1 | 10710 | 153 |
Figure 7 · The 153 Code · Detailed Study
The dates behind the shared center
File 54 Appendix B.2 uses an outer Luke boundary and its strict Protocol 1 Mirror target.
Schematic axis; center enlarged for readability. No civil year zero.
First span: 5356 BC → AD 35 = 5390 years
Second span: 36 BC → AD 5355 = 5390 years
5390 + 5390 − 70 = 10710 = 153 × 70
Sources: File 54 Appendix B.2: exact coordinates and protocol.
Model and calculation details
Civil BC/AD notation has no year zero. Across the divide, elapsed span = BC year + AD year − 1. Thus 5356 BC to AD 35 is 5390 years; 36 BC to AD 5355 is also 5390 years. The overlap from 36 BC to AD 35 is 70 years. The union is 5356 + 5355 − 1 = 10710 = 153 × 70. Summing the row lengths gives 10780 because the same 70-year center is counted twice. AD 5355 is the strict mirror target used here; the distinct same-label display block must not replace it.

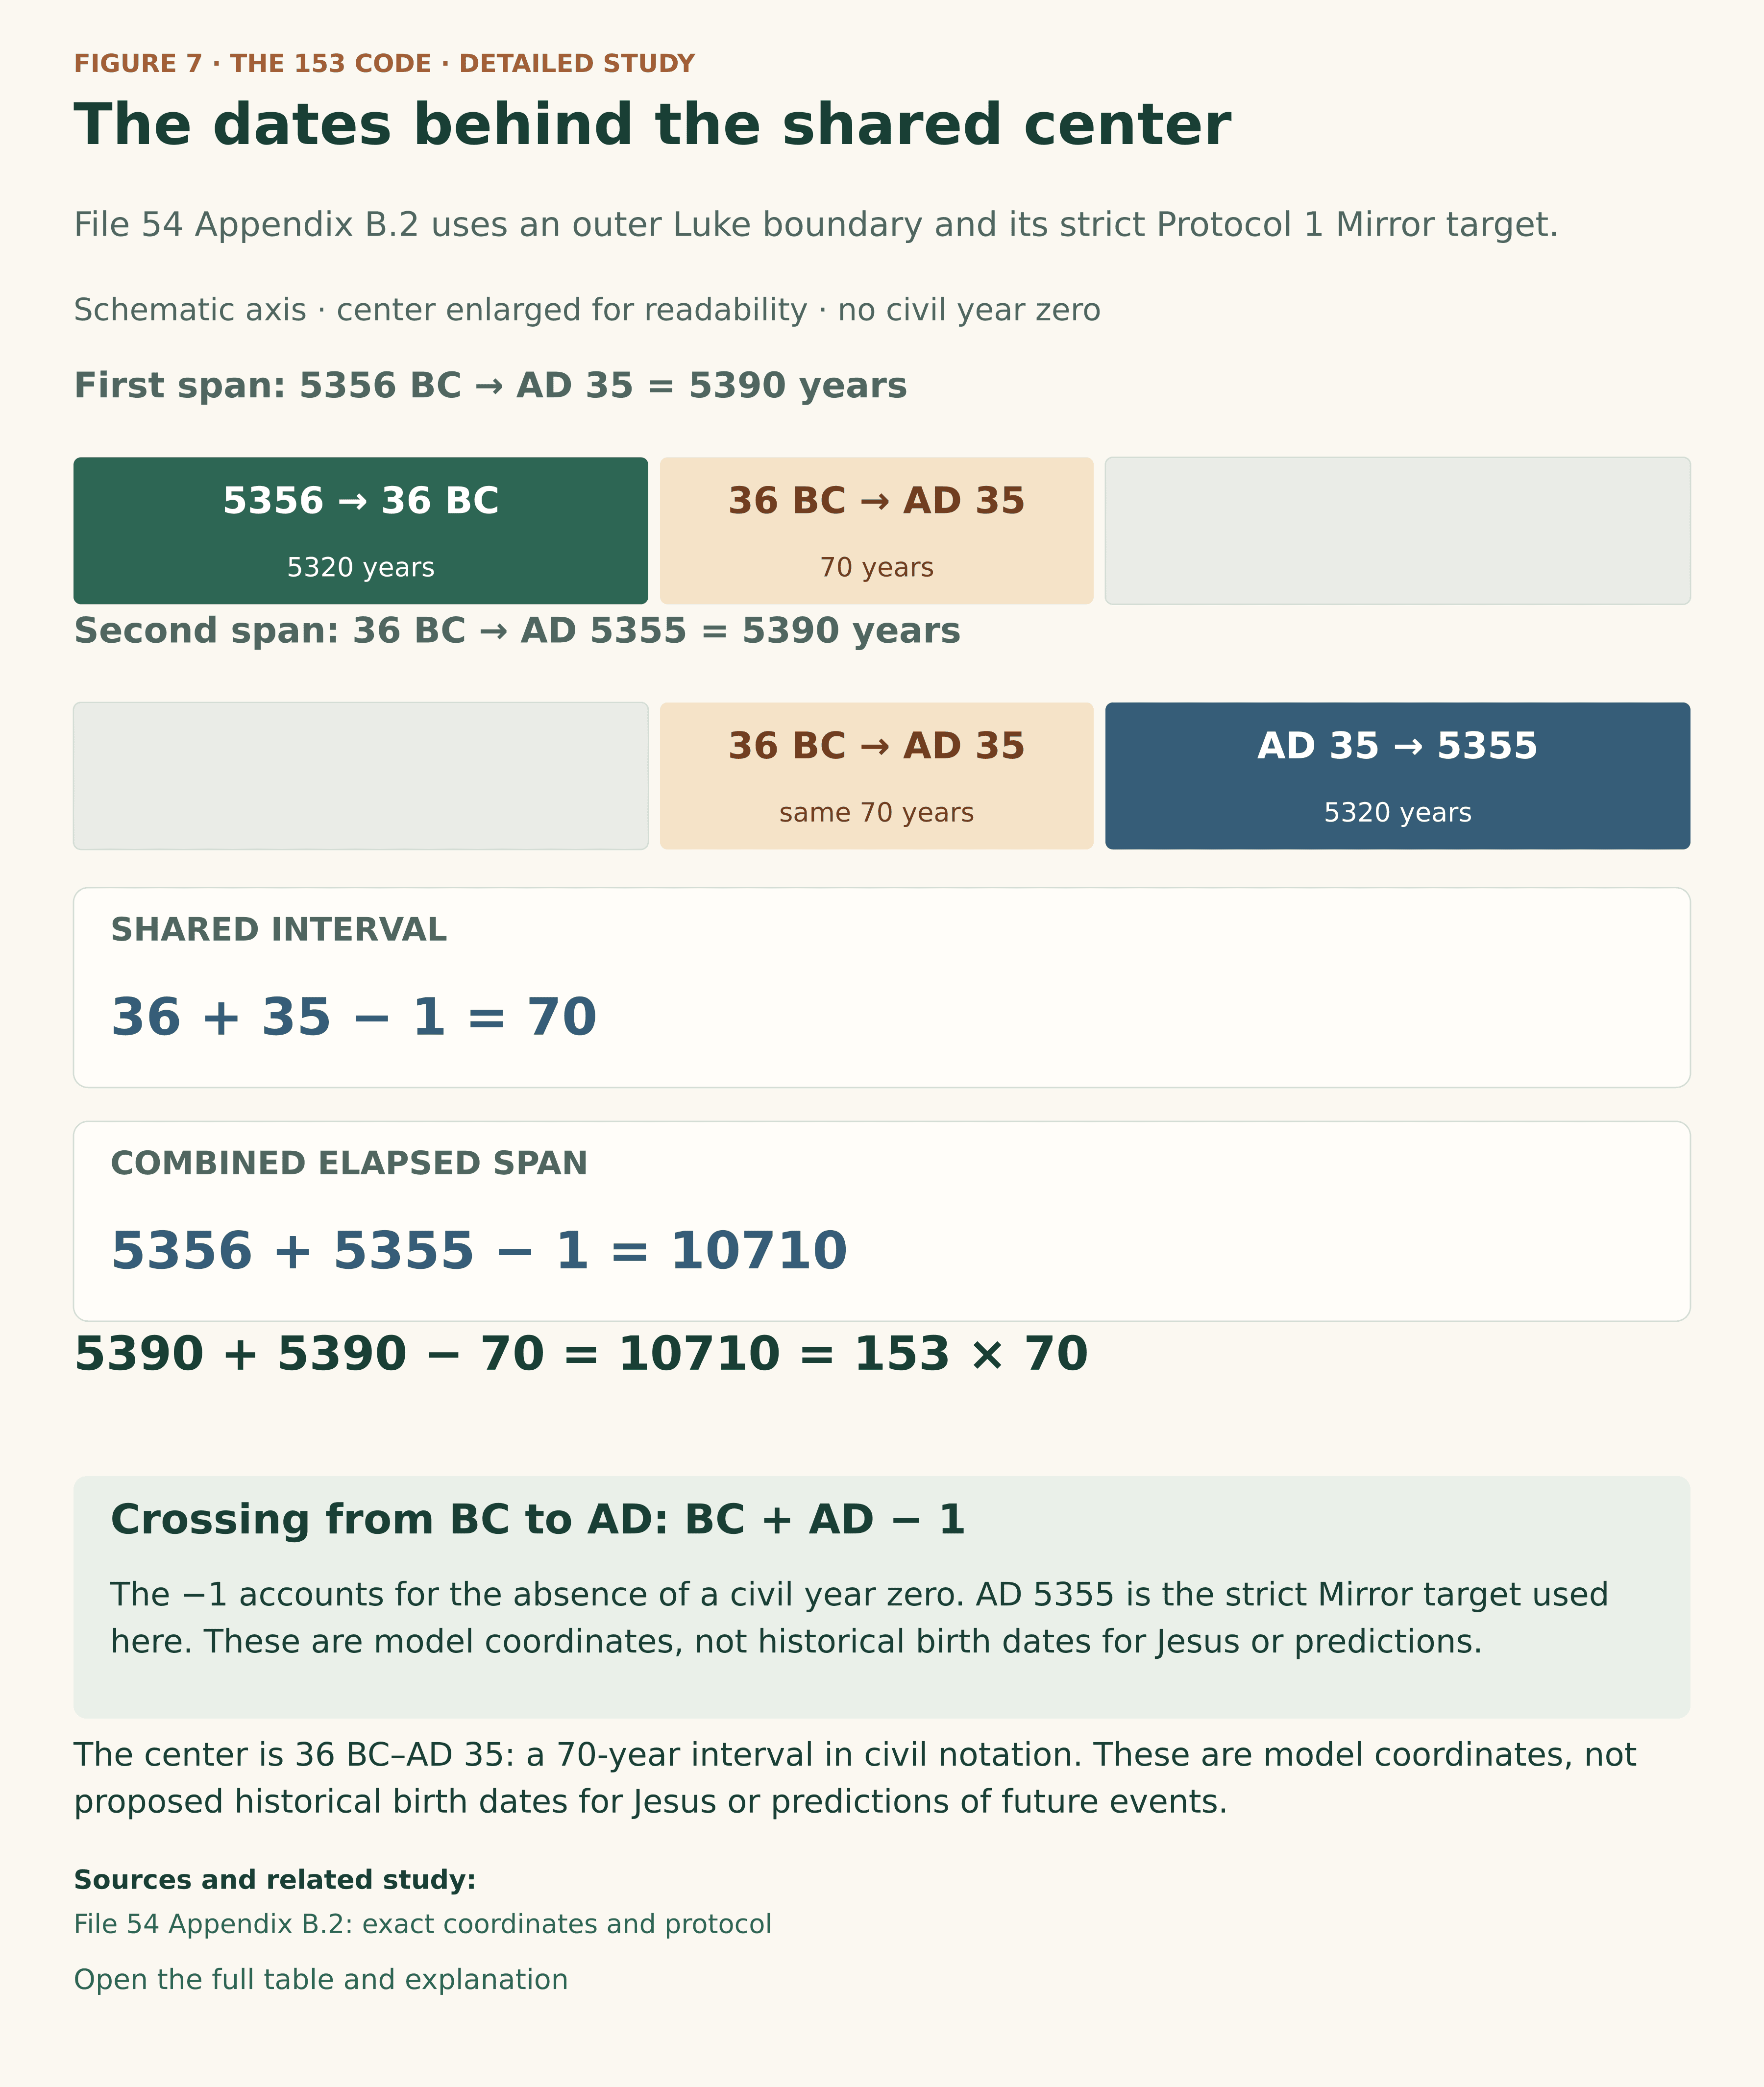
The first component runs from 5356 BC through AD 35; the second begins at 36 BC and extends to AD 5355. Each spans 5390 years. Their common interval is 70 years, so the combined extent is 5390 + 5390 − 70 = 10710. Counting both component lengths in full instead gives 10780.
File 54’s wider symbolic discussion also shows an AD 5286–5356 display block. It explicitly distinguishes that display from the strict target AD 5355 used for the computation. Substituting AD 5356 would produce 5356 + 5356 − 1 = 10711. The one-year distinction is therefore part of the model’s arithmetic, not a detail to round away.
Likewise, 36 BC–AD 35 is a model block associated with Christ, not a historical lifespan assigned to Jesus. The future AD boundary is a reflected coordinate, not a forecast of an event. Date labels in the diagram identify the calculation’s boundaries and should retain that function.
10. Sevens and jubilee measures
The aggregate of 154 blocks can be divided into 22 groups of seven:
154 = 22 × 7.
At 70 years per block, each group spans 7 × 70 = 490 years. The full identity is:
153 × 70 + 70 = 154 × 70 = 22 × 490 = 10780.
Each 77-block sequence has eleven groups of seven. Together, their separate lengths have twenty-two such groups. Their combined extent is one block shorter because the sequences share the central block.
A 490-year group also contains ten 49-year units: 490 = 10 × 49. Thus 10780 = 220 × 49. The total is twenty-two 490-year groups, not twenty-two 49-year jubilees; the latter would total only 1078 years.
A related comparison in the primary alignment
File 54 §8.6 gives a useful context for this sevenfold structure. In the 6 BC alignment, the full 77-block span can be divided as 21 + 35 + 21 units of 70 years. The same three parts are 30 + 50 + 30 units of 49 years.
| Segment | Model boundaries | Years | 70-year units | 49-year units |
|---|---|---|---|---|
| Luke model head → Jubilees-based Creation | 5326 BC → 3856 BC | 1470 | 21 | 30 |
| Jubilees-based Creation → Conquest | 3856 BC → 1406 BC | 2450 | 35 | 50 |
| Conquest → completed terminal block | 1406 BC → AD 65 | 1470 | 21 | 30 |
| Full 6 BC-alignment extent | 5326 BC → AD 65 | 5390 | 77 | 110 |
The central 2450 = 50 × 49 = 35 × 70 interval belongs to the study’s Jubilees-based chronological comparison. Its 3856 BC Creation coordinate is calculated within that framework relative to the 1406 BC Conquest anchor; the ancient text does not print a BC date of 3856. File 53 §7 records this Creation-to-Conquest framework. The table compares two ways of measuring the same defined spans.
This comparison uses the primary alignment from 5326 BC to AD 65. The 153-block construction uses the alternate outer boundary 5356 BC and the strict Mirror target AD 5355. Both use 70-year blocks, but their endpoints remain distinct. The table provides broader structural context without replacing the specific calculation in §9.
File 54 treats such compatibility with Jubilees-like chronology as evidence for a possible shared chronological environment. Its arithmetic does not prove that Luke directly borrowed from the Book of Jubilees. The additional 22-fold, alphabetic and First/Last parallels discussed in its appendix likewise belong to the interpretation surrounding the calculation.
11. Interpreting the correspondence
Three levels of evidence can now be distinguished. The narrative count comes from John: 153 large fish. The chronological construction comes from the selected genealogy inventory, 70-year units, stated boundaries and overlapping center. The theological reading relates the Christ-centered arrangement to the risen Jesus and the abundant catch.
The first is an explicit scriptural detail. The second is a defined model whose arithmetic can be reproduced. The third is the proposed correspondence explored by the study. Keeping those levels visible permits a theological reading without turning its interpretation into an unstated premise of the calculation.
File 54 Appendix B.2 classifies the fish connection as suggestive typological and reception-history correspondence. It also locates the Mirror comparison in an appendix, as completion of a coordinate relationship rather than the primary proof of the wider Luke–Jubilees argument. This detailed study preserves that proportion. It explains why the numerical relationship is coherent; it does not claim that the relationship establishes John’s intended explanation of the fish count.
What the arithmetic does and does not test
An exact product establishes what follows from chosen inputs. It does not, by itself, measure how surprising those inputs are, how many alternatives were considered or whether two textual traditions depend on one another. Repeated sums formed from overlapping sequences also reuse the same elements; they cannot simply be treated as independent observations.
For those reasons, no probability of chance occurrence is asserted here. The earlier discussion’s numerical significance claims are not needed to establish 153 × 70 = 10710 or the shared-center aggregate 10780 = 22 × 490. Neither is a larger set of orbital dates, calendar conversions or digit reversals required for these identities.
The present argument stands on a narrower, traceable foundation: selected life portions supply the units; the genealogy inventory supplies the positions; explicit boundaries distinguish intervals from completed blocks; and the common center explains the two totals. Within that framework, the correspondence with John’s fish can be considered on its theological merits while remaining open to examination.
12. Sources and downloadable tables
| Source | Role in this study |
|---|---|
| John 21:1–14, BSB | Narrative setting and the explicit 153-fish count |
| File 15: Generational Axiom, §§2, 4 and 5.3 | The 100/70/40 units, common 1400-year measure and Abraham’s overlapping spans |
| File 04: Jacob, §2.1 | Reconstructed Jacob age 77 and the 2006/1929/1859 BC sequence |
| File 18: Chronological Data Tables, §6A | The selected actual MT cumulative Adam coordinate at 14006 BC |
| File 43: Genealogical Bridge, §§2.1–2.3 and 3.4 | Selected name inventory and the two schematic alignments |
| File 54: Luke’s 70-Year Genealogical Lattice, §8.6 and Appendix B.2 | The 21 + 35 + 21 comparison, strict outer Mirror span, shared center and interpretive status |
| File 69: Enoch-Centered Genealogical Accordion, §1.8 | Distinction between 76 corresponding-boundary intervals and 77 completed blocks |
| File 00 §3.9 and File 09 Appendix A | Mirror-operation and civil-year counting controls |
Complete CSV downloads: generation measures, common 1400-year scale, Abraham’s age markers, counts, selected genealogy inventory, two alignments, products of 153, shared-center accounting, Mirror coordinates, and 70-/49-year comparison.
For a shorter entry into the subject, return to The 153 Fish: A Pattern of Generations and its supporting appendix.
Scripture quotations: Berean Standard Bible (BSB), public domain.
Scripture references identify the linked BSB edition. Calculations and the expressly identified File 43 genealogy inventory are the study’s own presentation, not quotations of BSB wording.