This appendix supports The 153 Fish: A Pattern of Generations. It records the age inputs, calculations and schematic dates behind the introductory diagrams. The controlling studies are File 15, File 54 and File 69. Their symbolic models are distinguished below from the ages and events explicitly stated in Scripture.
1. Ages and measures
The table compares selected portions of three lives. Abraham’s and Moses’ endpoint ages are explicit in Scripture; Jacob’s starting age is reconstructed from the repository chronology.
| Person / measure | Age inputs | Starting event and source (BSB) | Death age source (BSB) | Evidence |
|---|---|---|---|---|
| Abraham / 100 years | 175 − 75 = 100 | Departure from Haran; Genesis 12:4 | Genesis 25:7 | Both ages explicit; selecting this life portion as a standard is structural. |
| Jacob / 70 years | 147 − 77 = 70 | Flight to Haran / Bethel; Genesis 28:10–22 | Genesis 47:28 | Starting age 77 reconstructed in Files 04 and 15; death age 147 explicit. |
| Moses / 40 years | 120 − 80 = 40 | Speaking to Pharaoh; Exodus 7:7 | Deuteronomy 34:7 | Both ages explicit; the 80-year marker belongs to the call/Exodus transition. |
The ages in this table are written as digits for calculation. They paraphrase the linked passages; they are not quotations of those passages. File 15 §§0.7–0.9 and 2.1–2.2 controls the selection of these spans as structural units.
For Abraham, the explicitly aged event is his departure from Haran. For Moses, Exodus 7:7 gives his age when speaking to Pharaoh. The calling at the bush belongs to that wider transition; Acts 7:23 and 7:30 supply the earlier forty-year stages. These distinctions preserve the narrative setting of each age statement.
Jacob’s starting age has a different evidential basis. File 15 inherits from File 04 a birth at 2006 BC, flight to Haran at 1929 BC and death at 1859 BC. These produce 2006 − 1929 = 77 and 1929 − 1859 = 70. Genesis 28 supplies the Bethel narrative; the chronological reconstruction supplies age 77. The three measures therefore share a structural rationale without all their starting ages having identical textual support.
Download the age-and-source table.
2. Three products
These products apply each selected generational measure to 153. Only the 70-year row is developed below as a coordinate comparison.
| Years per block | Calculation | Total years | Use here |
|---|---|---|---|
| 40 | 153 × 40 | 6120 | Arithmetic comparison of scales; no independent chronology established here. |
| 70 | 153 × 70 | 10710 | Selected for the shared-center comparison in File 54 Appendix B.2. |
| 100 | 153 × 100 | 15300 | Arithmetic comparison of scales; no independent chronology established here. |
The exact proportion is 40 : 70 : 100 = 4 : 7 : 10. A further comparison, recorded in File 15, is their least common multiple:
1400 = 35 × 40 = 20 × 70 = 14 × 100.
This establishes that the three measures can express a common total. It does not supply a historical starting point or make each product an independently established timeline. File 54 Appendix B.2 is the control for the specific 153-by-70 comparison developed here.
3. Shared-center accounting
The introductory diagram represents two 77-block sequences that overlap by one block. This is an editorial visualization of File 54’s shared-center arithmetic. The diagram’s blocks are schematic units, each assigned 70 years.
| Count | Block calculation | Blocks | Years at 70 per block | Meaning |
|---|---|---|---|---|
| First sequence | 76 + 1 = 77 | 77 | 5390 | Left outer blocks and the common center. |
| Second sequence | 1 + 76 = 77 | 77 | 5390 | The common center and right outer blocks. |
| Common center | 1 × 70 | 1 | 70 | The same block belongs to both sequences. |
| Combined extent | 77 + 77 − 1 = 153 | 153 | 10710 | Shared center counted once. |
| Sum of sequence lengths | 77 + 77 = 154 | 154 | 10780 | Shared center counted in each component; aggregate, not extra elapsed time. |
The two valid totals answer different questions. 10710 measures the combined extent with the overlap counted once. 10780 adds the two component lengths and therefore includes the center twice. The source’s instruction to add back 70 years means restoring that second count. Neither an extra ancestor nor a further elapsed 70 years has been inserted.
4. Coordinates and the Mirror rule
File 54 Appendix B.2 selects the 36 BC rail: a particular alignment of its 70-year schematic generation blocks. Its outer boundary is 5356 BC. These coordinates belong to the study’s arrangement of Luke’s genealogy; they are not a claim that Genesis states a Creation date of 5356 BC or that Jesus was born in 36 BC.
The alignment is inherited from File 43 §§2.1–2.3. It is the alternate alignment placed 30 years before the model’s 6 BC alignment. Working backward from 36 BC through 75 intervals of 70 years gives 36 + 75 × 70 = 5286 BC. Including the model’s outer 70-year bookend gives 5286 + 70 = 5356 BC. The boundary thus belongs to an already defined genealogy model; the fish count is compared with its resulting outer span.
The source applies its Protocol 1 Mirror rule to that outer boundary, giving AD 5355. For this unsuffixed whole-year label, the result can also be checked using astronomical year numbering: 5356 BC is year −5355, whose integer opposite is +5355, or AD 5355. This numerical agreement does not identify Protocol 1 with the repository’s phase-resolved, Jan 1 covenant Mirror. Civil BC/AD labels have no year zero, so a span crossing their divide is calculated as BC year + AD year − 1. This is the rule used throughout the following table. File 00 §3.9 and File 09 Appendix A explain the wider distinction between individual dates and seasonal pairs.
| Component | Schematic boundaries | Civil span calculation | Years | 70-year blocks |
|---|---|---|---|---|
| First sequence | 5356 BC → AD 35 | 5356 + 35 − 1 | 5390 | 77 |
| Second sequence | 36 BC → AD 5355 | 36 + 5355 − 1 | 5390 | 77 |
| Shared center | 36 BC → AD 35 | 36 + 35 − 1 | 70 | 1 |
| Combined extent | 5356 BC → AD 5355 | 5356 + 5355 − 1 | 10710 | 153 |
Figure 4 · The 153 Fish
The dates behind the shared center
File 54 Appendix B.2 uses an outer Luke boundary and its strict Protocol 1 Mirror target.
Schematic axis; center enlarged for readability. No civil year zero.
First span: 5356 BC → AD 35 = 5390 years
Second span: 36 BC → AD 5355 = 5390 years
5390 + 5390 − 70 = 10710 = 153 × 70
Sources: File 54 Appendix B.2: exact coordinates and protocol.
Model and calculation details
Civil BC/AD notation has no year zero. Across the divide, elapsed span = BC year + AD year − 1. Thus 5356 BC to AD 35 is 5390 years; 36 BC to AD 5355 is also 5390 years. The overlap from 36 BC to AD 35 is 70 years. The union is 5356 + 5355 − 1 = 10710 = 153 × 70. Summing the row lengths gives 10780 because the same 70-year center is counted twice. AD 5355 is the strict mirror target used here; the distinct same-label display block must not replace it.

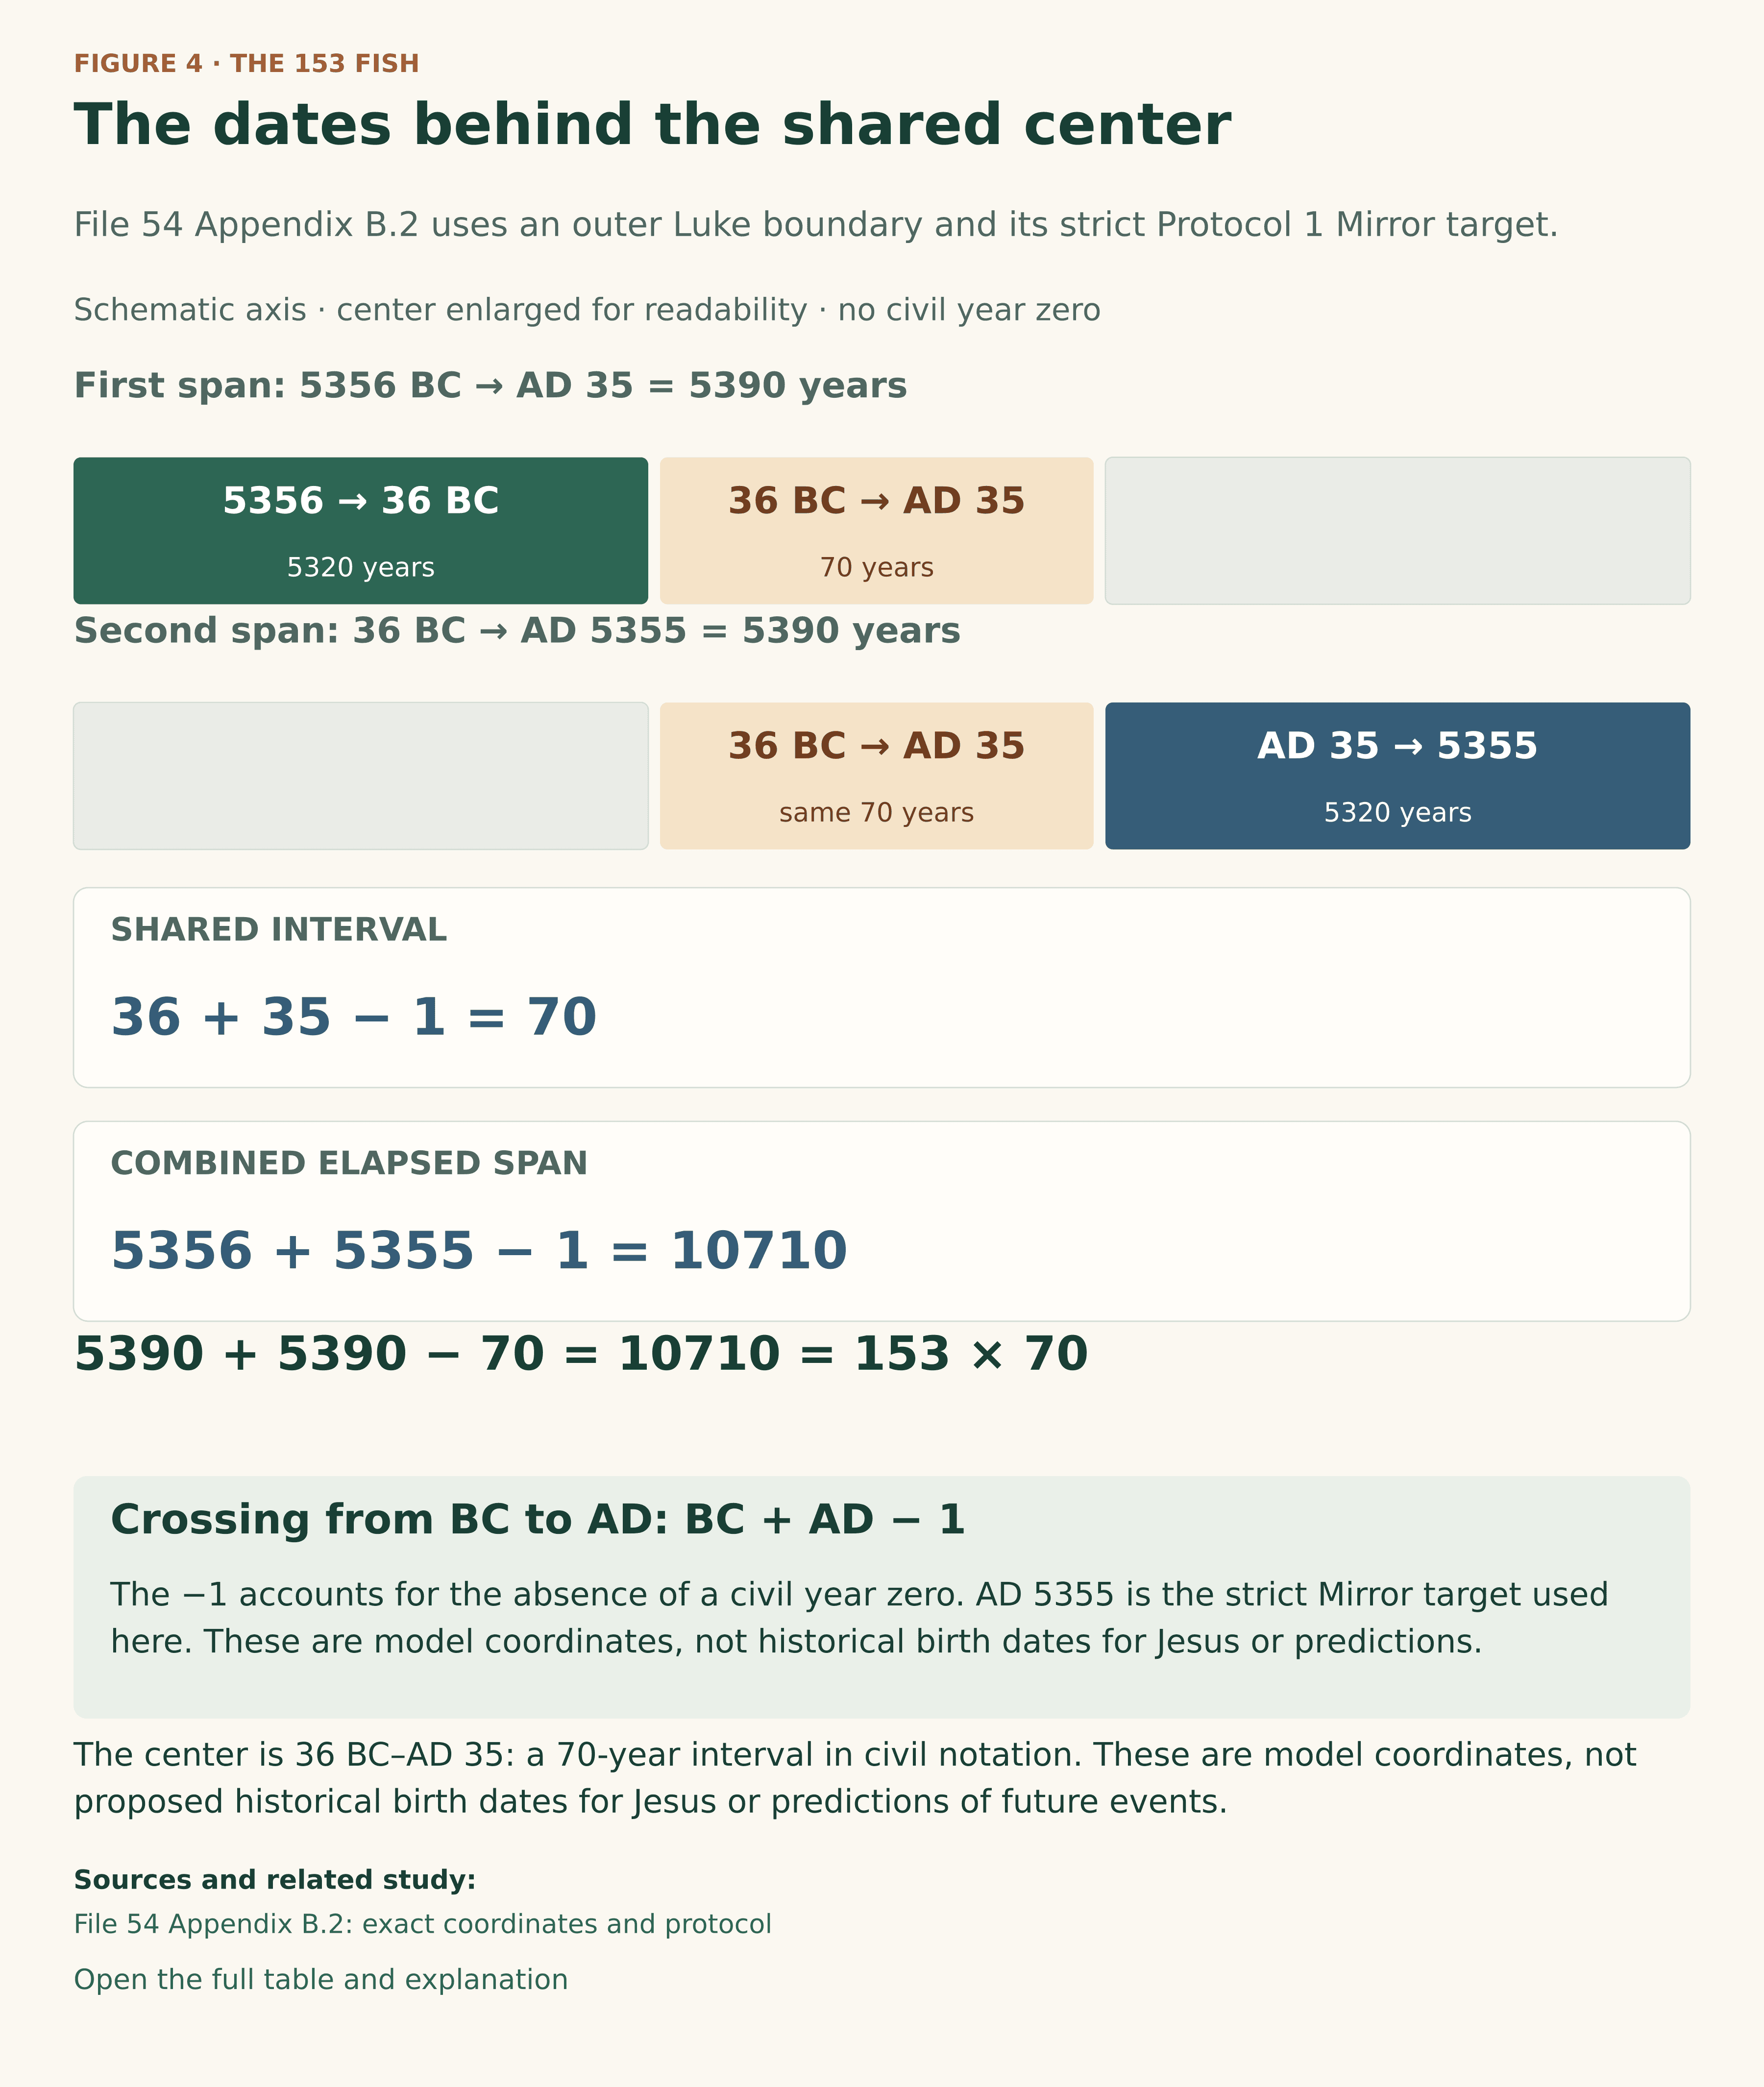
The two 5390-year components follow directly from the selected boundaries and the shared center. Their sum is 5390 + 5390 = 10780; their combined extent is 5390 + 5390 − 70 = 10710. The diagram therefore presents a union and a sum of overlapping lengths, rather than two rival dates for the same event.
File 54 also uses an AD 5286–5356 display block in its symbolic discussion. It explicitly distinguishes that display from the strict target AD 5355 used above. Substituting AD 5356 into the outer-span calculation would yield 10711, which is not the 153-by-70 result. The present table preserves the source’s computational boundaries.
These dates serve a schematic comparison. The future AD labels identify reflected coordinates, with no forecast of an event at either endpoint. The general Mirror method has additional rules for paired seasonal dates; this appendix reproduces only the single-date comparison selected in File 54.
Download the coordinate table.
5. Names, intervals and blocks
A list of 77 occupied positions has 76 steps from its first position to its last. A diagram that assigns a whole block to each position can also measure 77 completed blocks. Which total applies depends on the boundaries being compared.
The model’s name inventory also needs to be identified. File 43 §3.4 uses 76 human entries from Adam to Jesus, with a figurative God bookend giving 77 positions. Its selected sequence contains Hezron → Ram → Amminadab. The linked BSB text of Luke 3:33 instead contains Hezron → Arni → Admin → Amminadab when read in ancestor-to-descendant order. Counting that BSB list from Jesus through God gives 78 entries, including both endpoints. The schematic 77-position model must therefore be distinguished from a raw count of the BSB edition’s names.
Files 54 and 69 retain the distinction between corresponding boundaries and completed blocks in their treatment of Luke 3:23–38. The following two examples use the 6 BC alignment, a different alignment from the 36 BC one selected in §4:
| Comparison in the 6 BC alignment | Years | What is counted |
|---|---|---|
| 5326 BC → 6 BC | 5320 = 76 × 70 | Corresponding boundaries, 76 intervals apart |
| 5326 BC → AD 65 | 5390 = 77 × 70 | Full outer extent, including the completed central generation block |
The extra 70 years comes from changing the ending boundary. These totals cannot be exchanged while leaving the endpoints unchanged. File 69 §1.8 explicitly preserves this distinction. Its figurative divine head is part of the schematic arrangement; it does not assign God a finite human lifespan.
Likewise, the 153 in the overlap illustration counts distinct 70-year blocks after combining two sequences. It does not enumerate 153 names printed in Luke, and 153 + 1 does not require adding a missing person to a biblical genealogy. MT, SP and LXX genealogical variants are not being combined to obtain this block count.
6. Sevenfold grouping
The following identities group the summed 154-block count into sets of seven and then express it in 490- and 49-year units.
| Step | Exact identity | Meaning |
|---|---|---|
| One sequence | 77 = 11 × 7 | Eleven groups of seven blocks |
| Two sequence lengths | 154 = 22 × 7 | Twenty-two groups of seven, including the shared center in each sequence |
| One group in years | 7 × 70 = 490 | A group of seven 70-year blocks |
| Sum of the two lengths | 154 × 70 = 22 × 490 = 10780 | Aggregate including the center twice |
| Relation to 49-year jubilees | 490 = 10 × 49; 10780 = 220 × 49 | Ten jubilee units per 490-year group |
The phrase twenty-two 490-year groups keeps the scale clear. Calling them twenty-two 49-year jubilees would instead give 22 × 49 = 1078, a tenth of the required total.
File 54 places additional 22-fold and First/Last correspondences around its calculation. They belong to its theological and reception-history discussion. The present introduction focuses on the overlap identity; it does not need those additional parallels to establish the arithmetic.
7. Evidence and interpretation
The table separates explicit narrative data, arithmetic within the defined model and the proposed theological correspondence.
| Claim | Basis | Appropriate strength |
|---|---|---|
| The catch contains 153 large fish | John 21:11, verified in BSB | Explicit narrative count |
| The three selected life portions are 100, 70 and 40 years | Biblical age statements plus the reconstructed Jacob starting age; File 15 | Arithmetic within a stated structural framework |
| Two 77-block sequences sharing one block occupy 153 blocks | Defined overlap | Exact counting identity |
| The selected outer span is 10710 years | File 54’s 5356 BC / AD 5355 coordinates and civil cross-era arithmetic | Exact result within the selected model |
| Counting both component lengths gives 10780 = 22 × 490 | Shared center counted in each component | Exact aggregate; not extra elapsed time |
| The 153 fish correspond symbolically to that pattern | File 54 Appendix B.2, Johannine note | Suggestive theological and reception-history correspondence |
The canonical source places this Mirror comparison in an appendix. It treats it as completion of a coordinate relationship, not the primary proof of its wider Luke–Jubilees argument. Its Johannine note expressly withholds a claim of direct authorial dependence. The introductory article preserves that order: the narrative count is explicit, the model is defined, and the theological relationship remains interpretive.
The earlier exploratory discussion contains a much larger collection of date clusters, transformations and statistical assertions. This introduction draws on the bounded relationship established in the current canonical files. No probability of chance occurrence is asserted, and the selected example does not validate every construction in the predecessor.
For the controlling sources, read File 15 §§0.7–0.9 and 2.1–2.2, File 54 Appendix B.2, and File 69 §1.8. Return to the illustrated introduction. For the full treatment, read the detailed study.
Scripture quotations: Berean Standard Bible (BSB), public domain.
Ages and calculations in the tables are presented in the study’s own notation.