So Simon Peter went aboard and dragged the net ashore. It was full of large fish, 153, but even with so many, the net was not torn.
John’s final chapter brings the disciples from an empty night of fishing to an abundant catch and a meal with the risen Jesus. Within that scene, the Gospel preserves a precise number: 153 large fish. The unbroken net holds the whole catch. John 21:1–14 gives the narrative setting; it does not explain the number through a chronological calculation.
This study considers one proposed correspondence between that number and a pattern of generations. Its central relationship is simple enough to see: two sequences of 77 generation blocks, sharing one central block, occupy 153 distinct blocks. At 70 years per block, their combined extent is 10710 years. Counting the common block in each sequence gives a different total: 10780 years, or 22 groups of 490.
The arithmetic is exact. Its connection with John’s fish is a proposed theological interpretation, presented in File 54 Appendix B.2 as a suggestive correspondence. The diagrams below explain the calculation first; the supporting tables and source notes show where its units and boundaries come from.
1. Three ways of measuring a generation
In this framework, a generation is a defined chronological measuring unit. The three standards—40, 70 and 100 years—are drawn from the portions of Moses’, Jacob’s and Abraham’s lives associated with their calling and subsequent service.
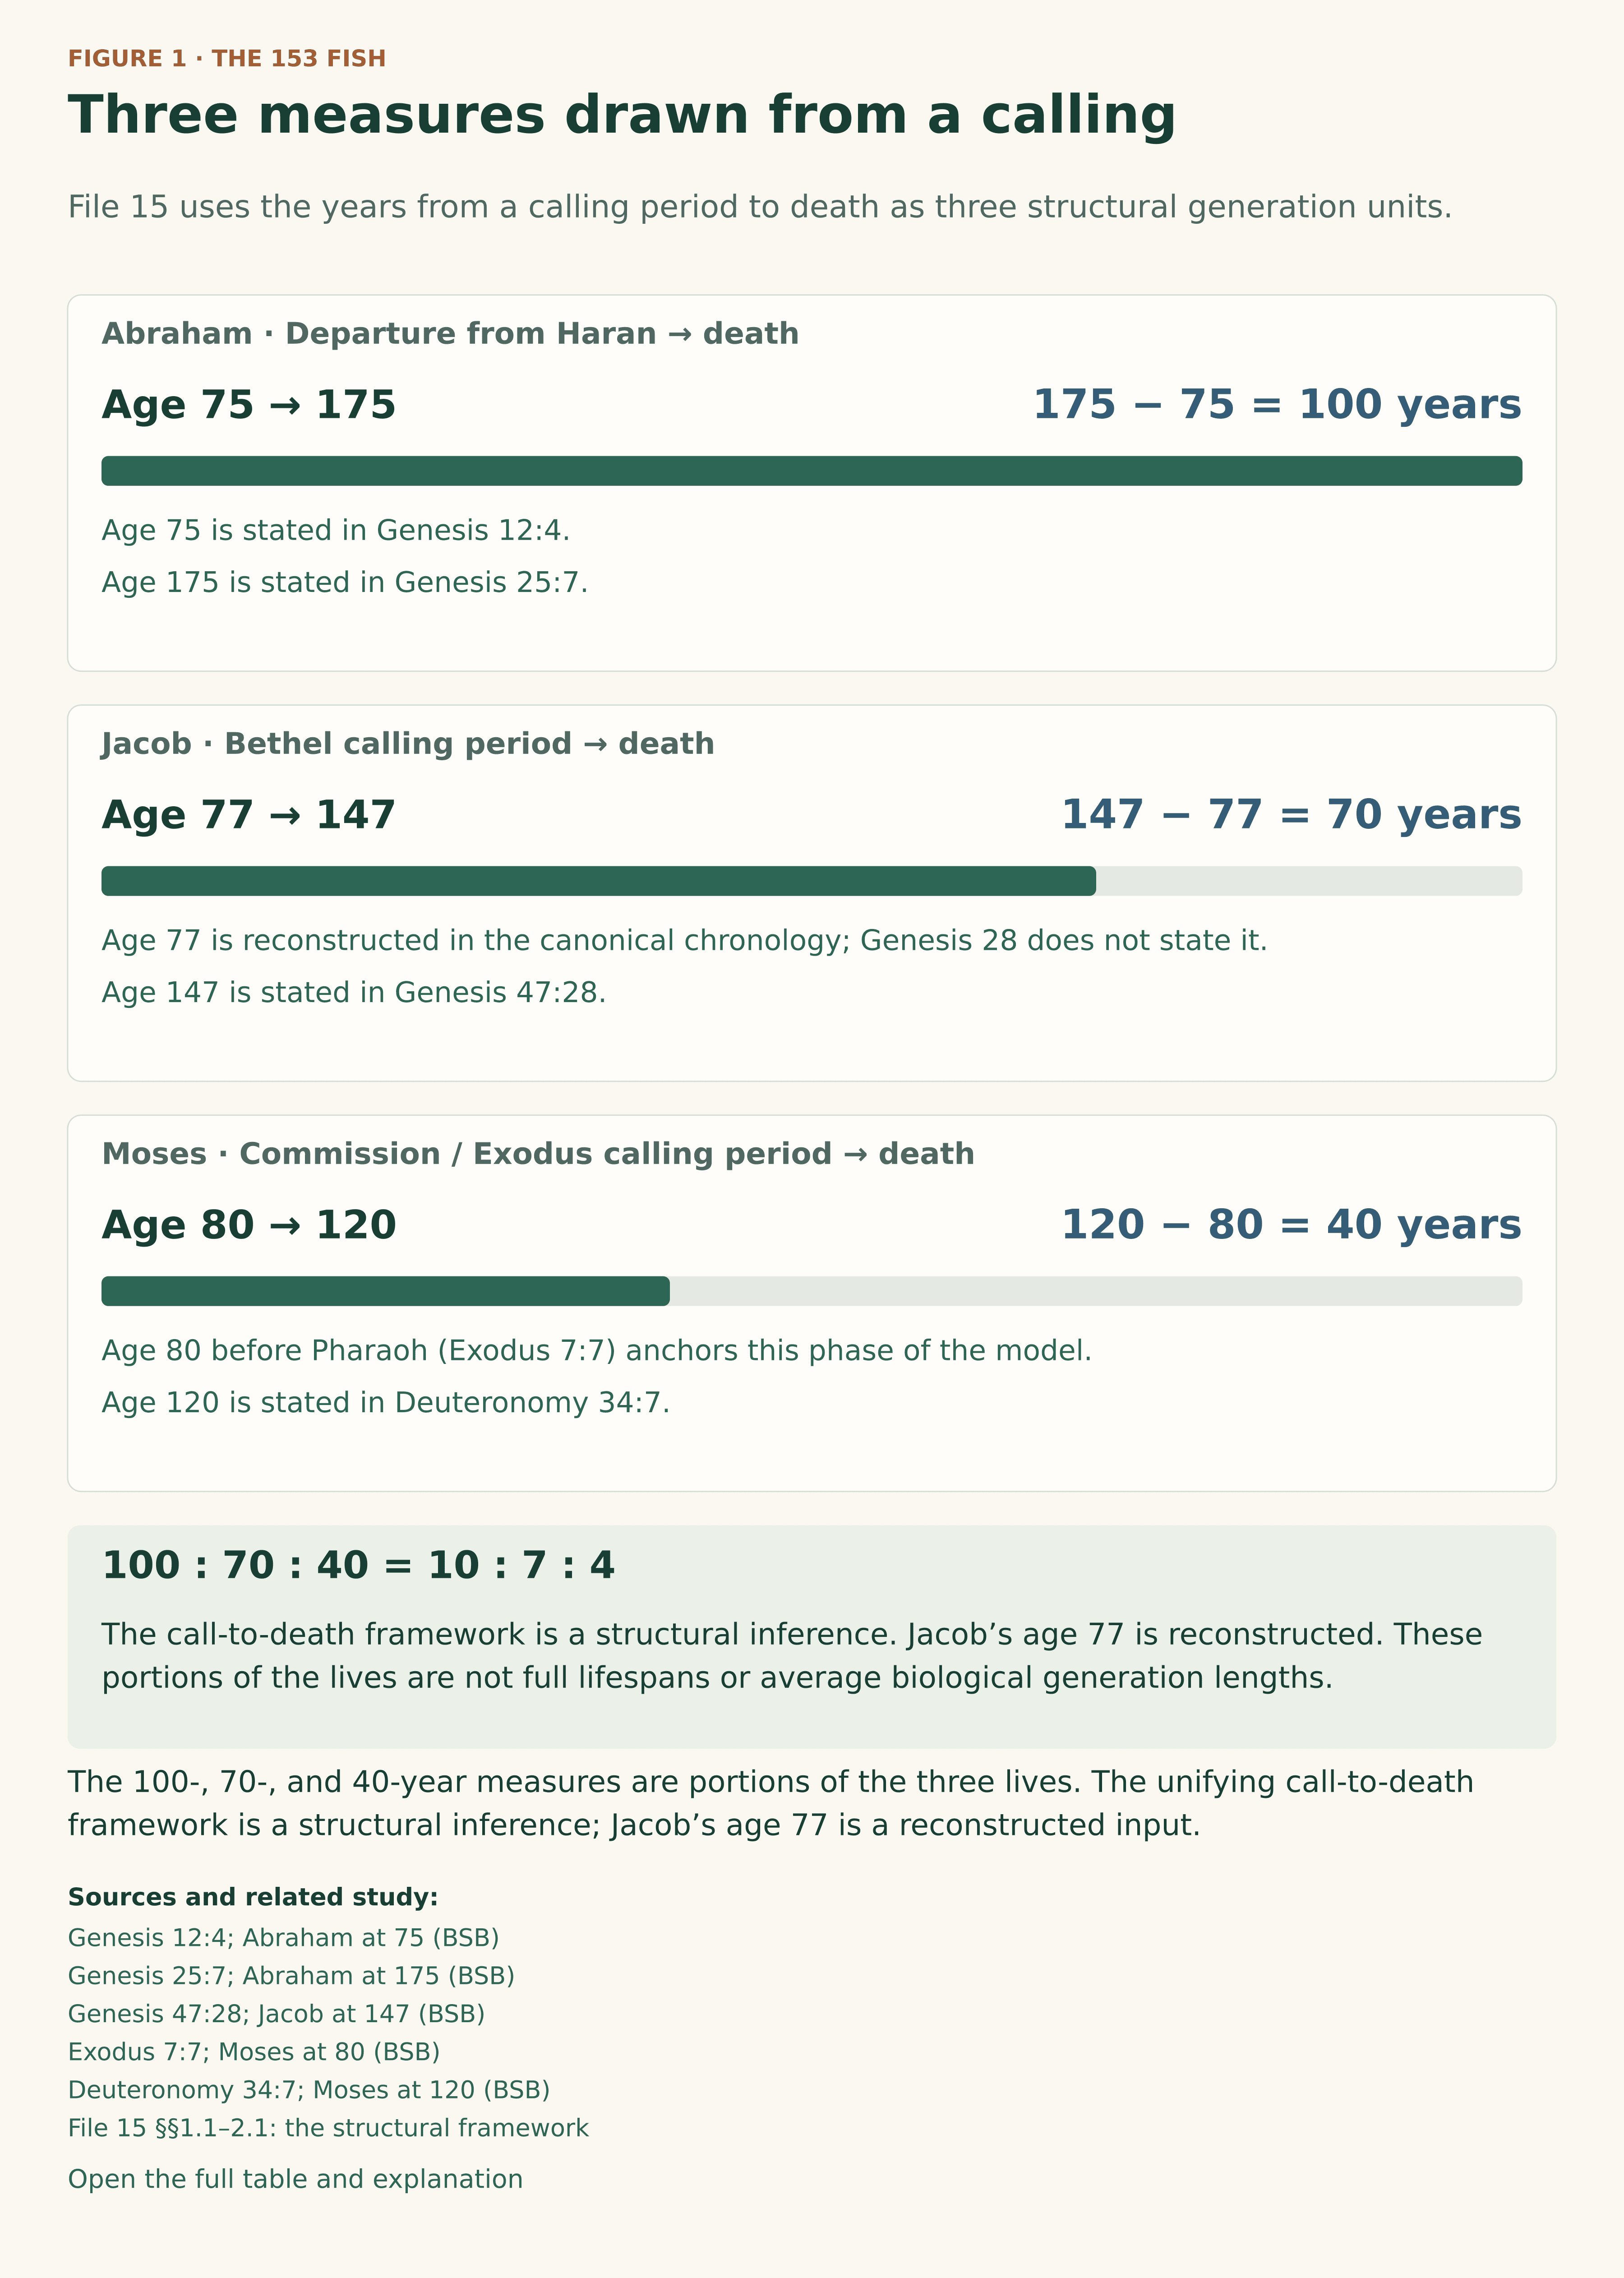
Abraham was 75 when he departed Haran and lived to 175. The remaining span is therefore 175 − 75 = 100 years. Moses was 80 when he spoke to Pharaoh and died at 120, giving 120 − 80 = 40 years. These ages are stated in Genesis 12:4, Genesis 25:7, Exodus 7:7 and Deuteronomy 34:7.
Jacob supplies the middle measure. He lived to 147, according to Genesis 47:28. The chronology places his flight to Haran and encounter at Bethel at age 77, leaving 147 − 77 = 70 years. That starting age is reconstructed from the chronology; Genesis 28 recounts the encounter without stating his age.
Figure 1 · The 153 Fish
Three measures drawn from a calling
File 15 uses the years from a calling period to death as three structural generation units.
Abraham
Age 75 → 175
Departure from Haran → death
175 − 75 = 100
100-year unit
Jacob
Age 77 → 147
Bethel calling period → death
147 − 77 = 70
70-year unit
Age 77 is reconstructed in the canonical chronology; Genesis 28 does not state it.
Moses
Age 80 → 120
Commission / Exodus calling period → death
120 − 80 = 40
40-year unit
Age 80 before Pharaoh (Exodus 7:7) anchors this phase of the model.
Sources: Genesis 12:4; Abraham at 75 (BSB) · Genesis 25:7; Abraham at 175 (BSB) · Genesis 47:28; Jacob at 147 (BSB) · Exodus 7:7; Moses at 80 (BSB) · Deuteronomy 34:7; Moses at 120 (BSB) · File 15 §§1.1–2.1: the structural framework.
Model and calculation details
The arithmetic is 175 − 75 = 100; 147 − 77 = 70; and 120 − 80 = 40. Genesis 12:4 states Abraham’s age when he departs Haran. Jacob’s age at Bethel is reconstructed in the canonical chronology, not supplied by Genesis 28. Exodus 7:7 states Moses’ age when he speaks to Pharaoh, while File 15 treats age 80 as the calling period for the Exodus phase. These units are not generic biological generation lengths or the men’s full lifespans.

File 15 calls this common way of measuring from the calling period to death a structural axiom. It selects comparable portions of three lives and uses their lengths as standards for further study. The full lifespans remain 175, 147 and 120 years; the chosen units are 100, 70 and 40. Nor does the framework require every parent and child in a genealogy to be separated by one of these intervals.
The measures have the exact proportion 40 : 70 : 100 = 4 : 7 : 10. Keeping the selected unit visible allows readers to follow a calculation without confusing its scale with a person’s age. The age-and-source table records the evidence for each measure.
2. What happens when 153 is measured in years?
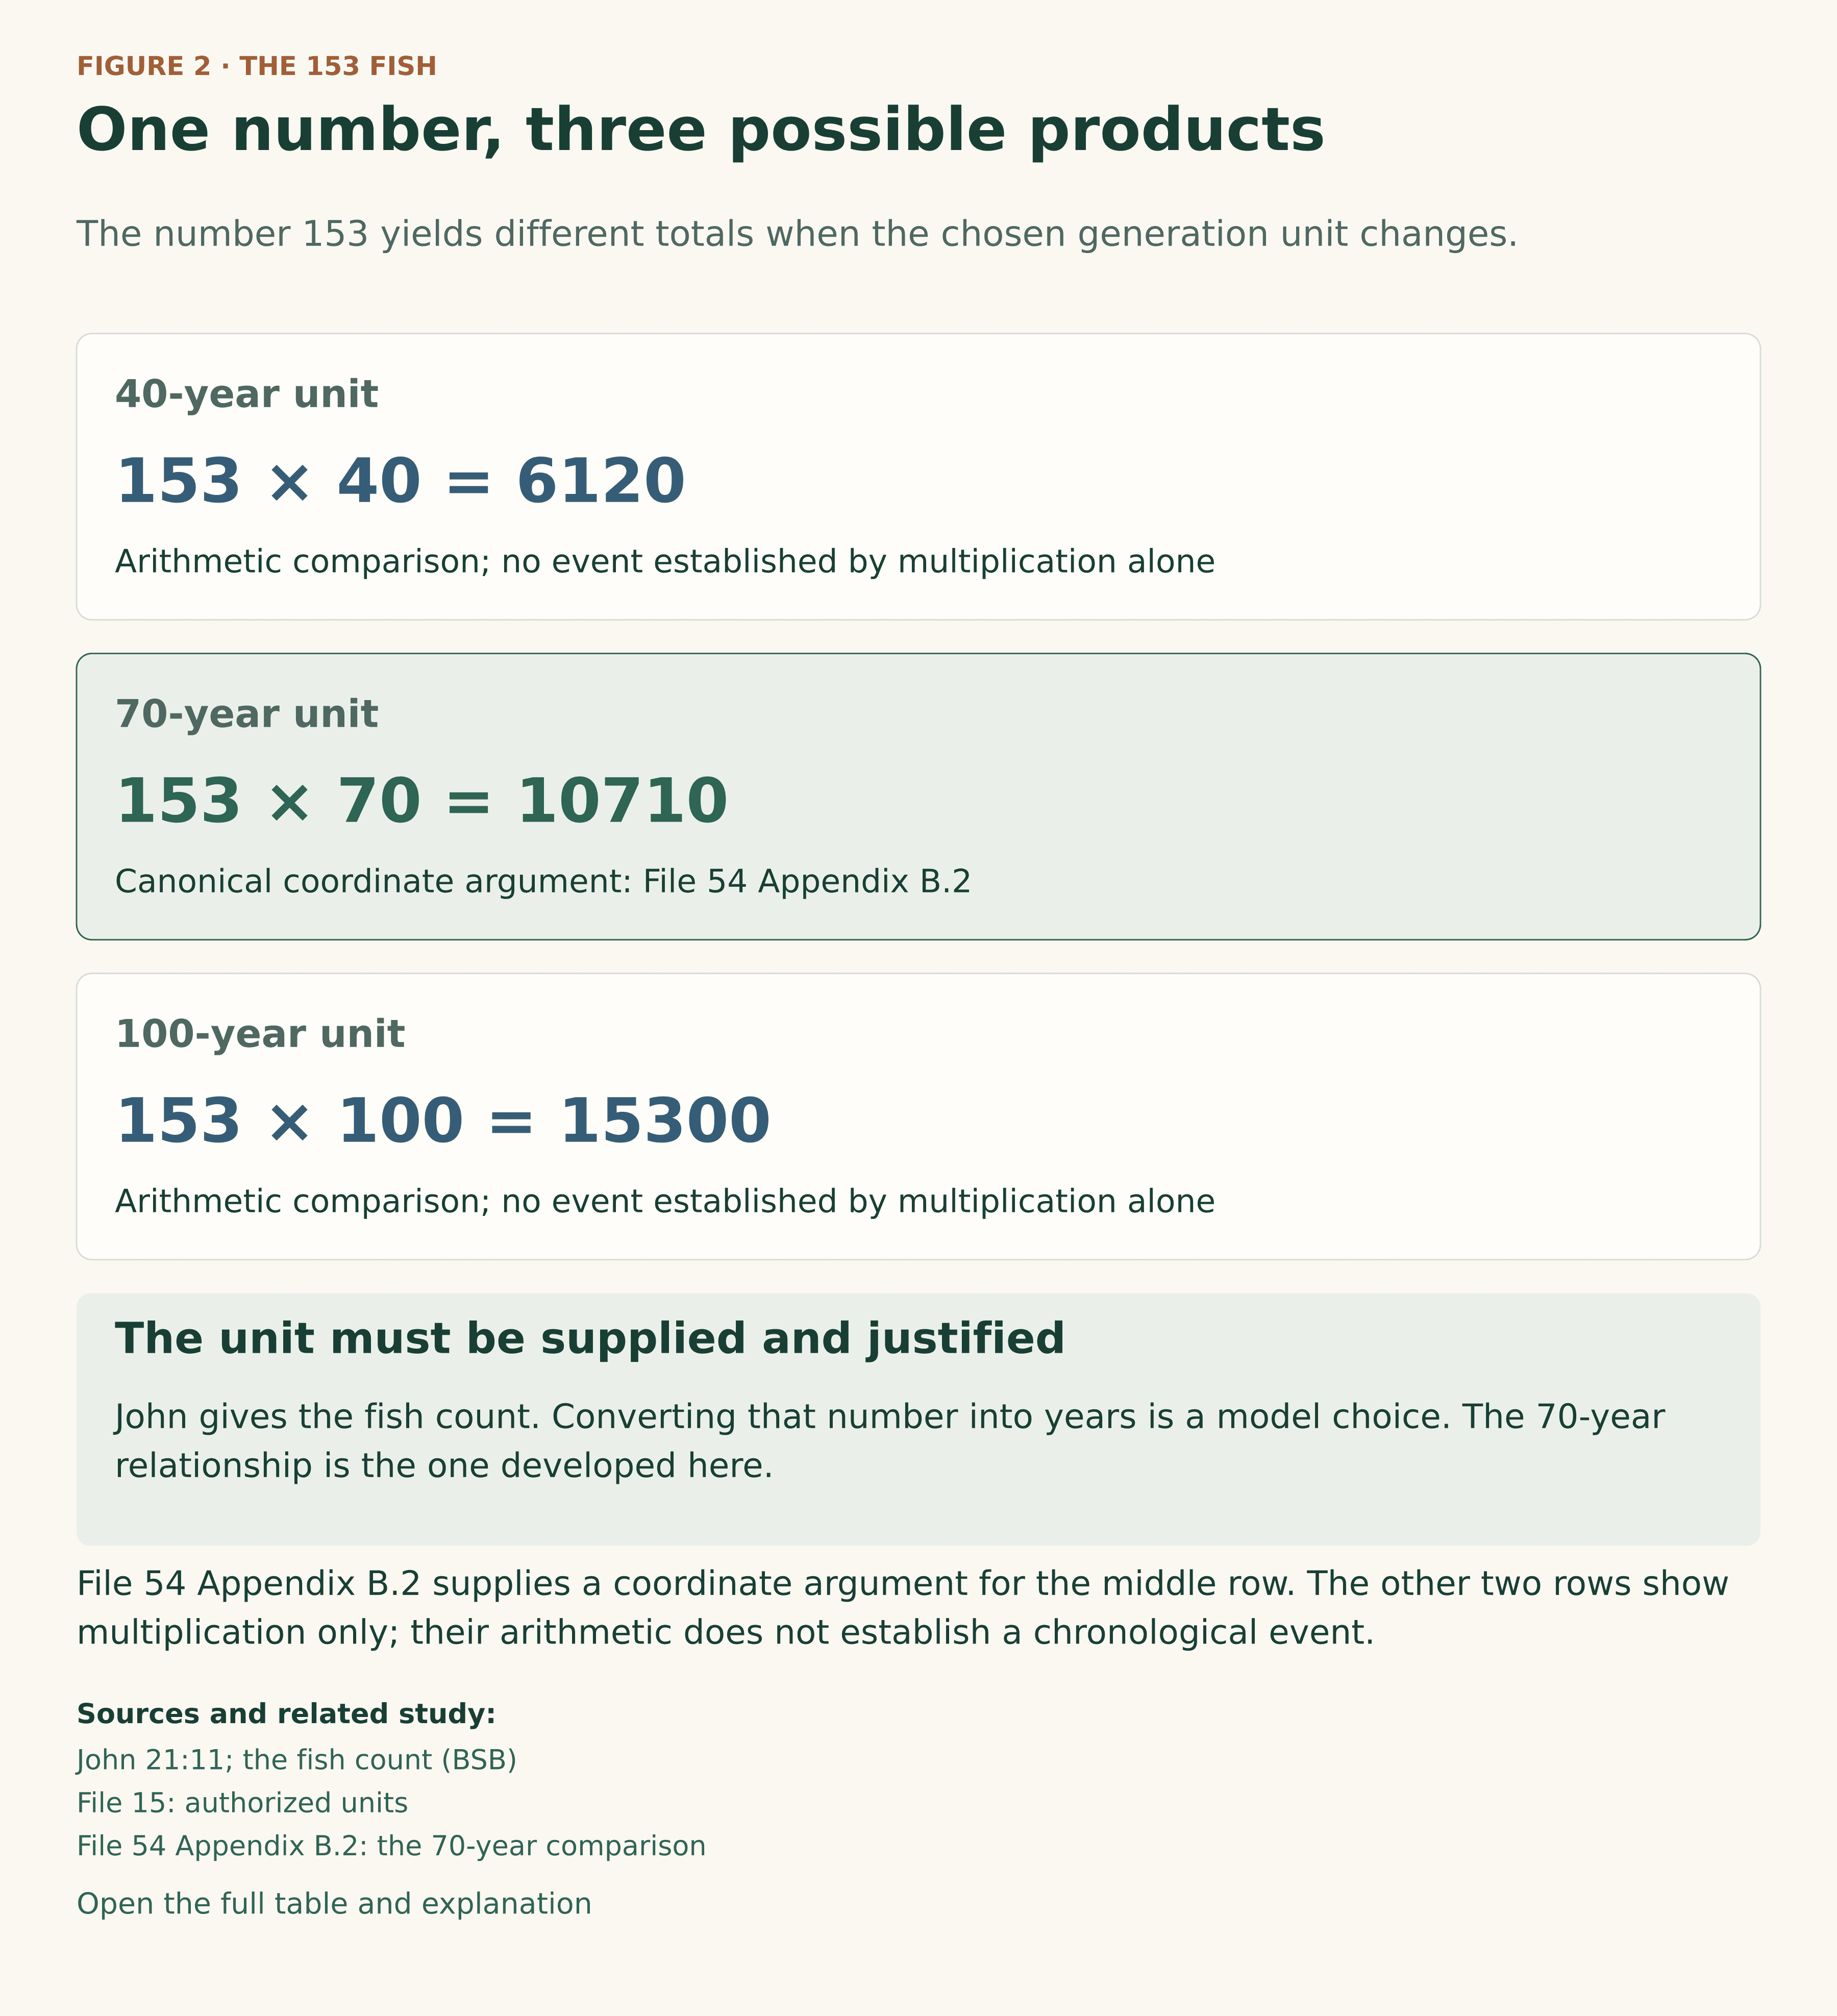
Multiplying 153 by each measure gives three different totals:
Figure 2 · The 153 Fish
One number, three possible products
The number 153 yields different totals when the chosen generation unit changes.
= 6120
= 10710
= 15300
Sources: John 21:11; the fish count (BSB) · File 15: authorized units · File 54 Appendix B.2: the 70-year comparison.
Model and calculation details
John 21:11 supplies the count of 153 fish, not a unit of years. Applying a 40-, 70-, or 100-year unit is a further model choice. The 70-year product has a specific canonical coordinate relationship in File 54 Appendix B.2. Neither the three products nor their exactness proves that John intended a generational code.

These are three exact products. A chronological argument also needs a reason to select a unit and a defined set of boundaries. The example developed here uses 70 years, the unit employed in File 54’s schematic treatment of Luke’s genealogy. The 40- and 100-year products help us compare scales; the shared-center argument below belongs specifically to the 70-year model.
In that model, a generation block is a space on a chronological diagram. It is useful to distinguish such a block from a named ancestor and from the interval between two named people. The number 153 in this study counts blocks in a combined diagram. It is not a claim that Luke names 153 ancestors. The counting note explains why a diagram can also distinguish 76 intervals from 77 completed blocks.
3. One center shared by two sequences
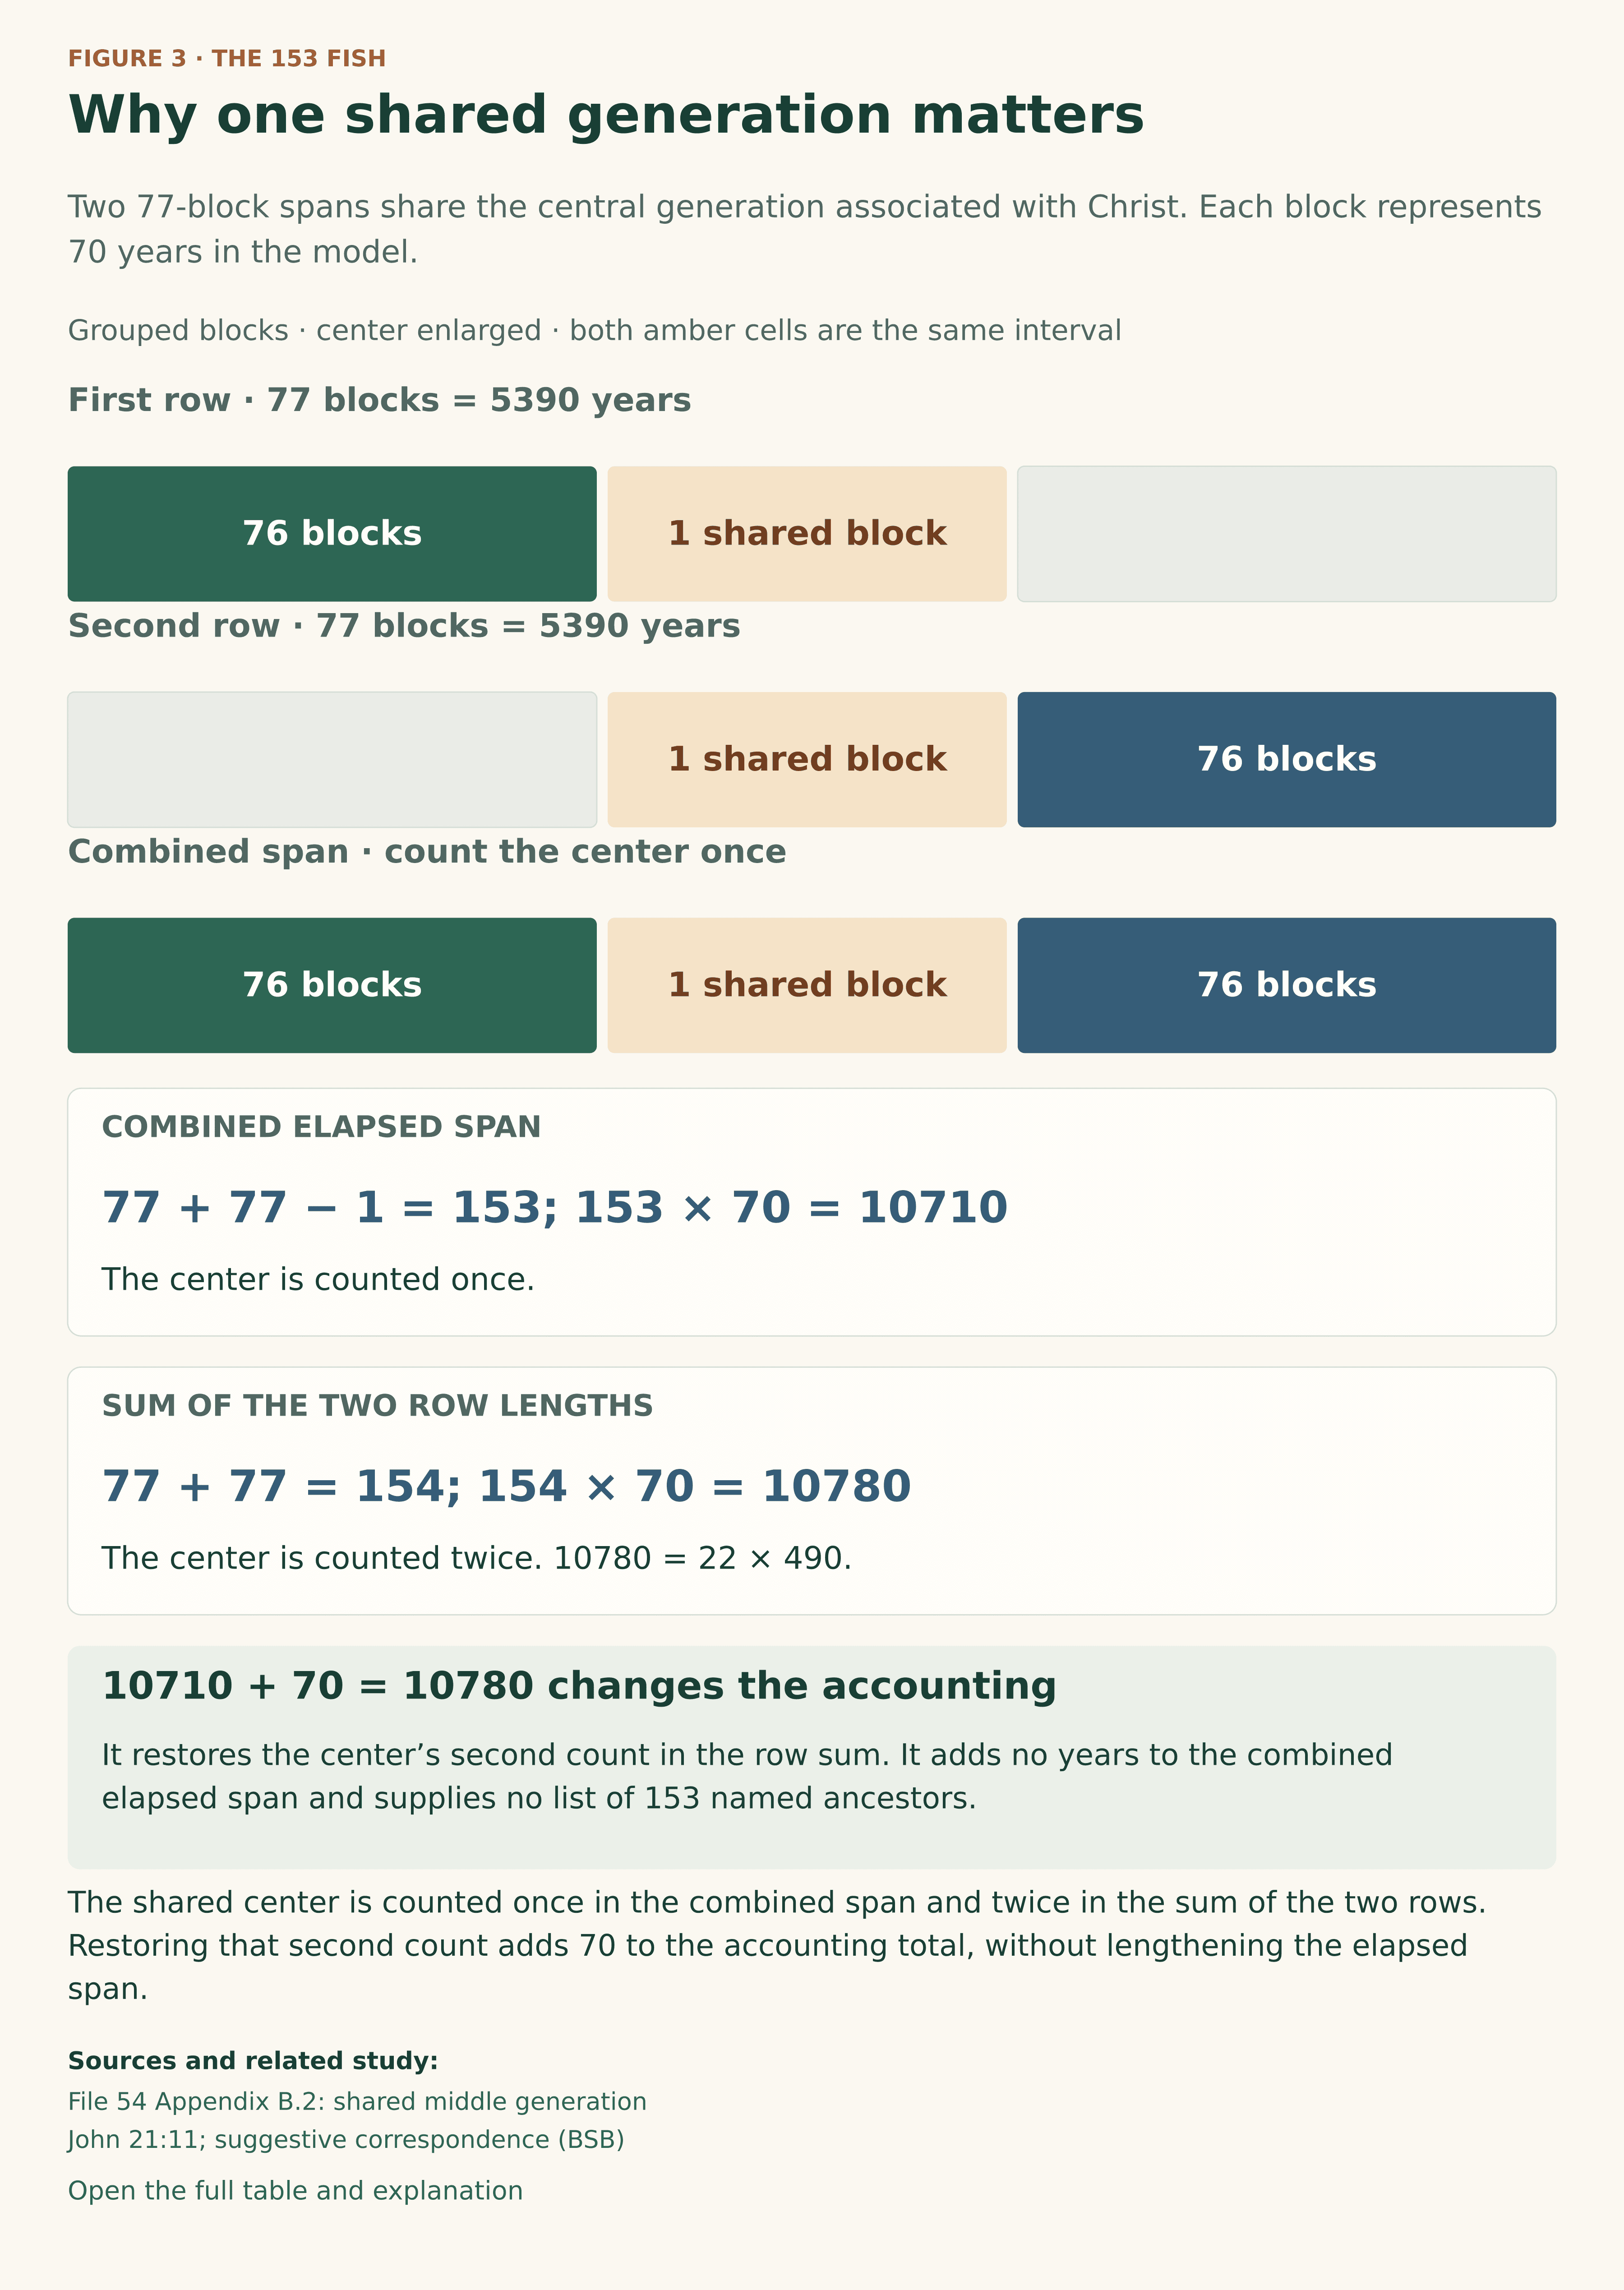
Picture two sequences, each containing 77 blocks. The last block of the first sequence is also the first block of the second. This common block is the model’s central generation associated with Christ.
Counting every occupied block once gives:
76 + 1 + 76 = 153 blocks.
Equivalently:
77 + 77 − 1 = 153.
The subtraction prevents the shared center from being counted twice. At 70 years per block, the combined extent is 153 × 70 = 10710 years.
Figure 3 · The 153 Fish
Why one shared generation matters
Two 77-block spans share the central generation associated with Christ. Each block represents 70 years in the model.
Grouped blocks; center enlarged for readability. Both amber cells represent the same interval.
First row · 77 blocks
Second row · 77 blocks
Combined span · count the center once
77 + 77 − 1 = 153
153 × 70 = 10710
The center is counted once.
77 + 77 = 154
154 × 70 = 10780
10780 = 22 × 490
The center is counted twice.
Sources: File 54 Appendix B.2: shared middle generation · John 21:11; suggestive correspondence (BSB).
Model and calculation details
Each row contains 76 outer blocks and the shared central block: 77 × 70 = 5390. Their union is 76 + 1 + 76 = 153 blocks, or 10710 elapsed years. Adding the two row lengths counts the center twice: 77 + 77 = 154 blocks, or 10780 = 22 × 490. These are schematic blocks, not a count of 153 named ancestors. The relation to John’s fish is suggestive theological correspondence, not proof of authorial dependence.

Now ask a different question: what is the sum of the two sequence lengths? Each contains 77 blocks, so their lengths add to 154 blocks. That sum includes the central block once for each sequence:
77 × 70 + 77 × 70 = 154 × 70 = 10780 years.
Thus 10710 + 70 = 10780 restores the second count of the shared center. It does not create another elapsed interval between the outer boundaries. The distinction is the same as adding the lengths of two overlapping stretches of a road: their separate lengths include the shared stretch twice, while the complete route includes it once.
This is a visual explanation of File 54 Appendix B.2. The source specifies an outer boundary at 5356 BC, its strict Mirror counterpart at AD 5355, and a shared center from 36 BC to AD 35. These are coordinates in a schematic comparison. They neither place Jesus’ historical birth at 36 BC nor predict an event in AD 5355. The coordinate table and diagram show the full calculation and its counting convention.
4. From the shared center to groups of seven
The summed count of 154 blocks can be arranged into 22 groups of seven:
154 = 22 × 7.
With each block representing 70 years, a group of seven represents 7 × 70 = 490 years. The complete identity is therefore:
153 × 70 + 70 = 154 × 70 = 22 × 490 = 10780.
The same total can be described in jubilee units: 490 = 10 × 49. It contains twenty-two 490-year groups, or 220 units of 49 years. A 49-year jubilee and a 490-year group must retain their different sizes.
This gives the shared-center construction its sevenfold form. Each 77-block sequence contains eleven groups of seven. Their separate totals give twenty-two such groups; the combined extent is one block shorter because the sequences share their center.
5. Reading the correspondence
The proposed connection with John begins where the two sequences meet. The diagram centers the generations on Christ; John’s closing scene centers the disciples’ abundance and fellowship on the risen Jesus. The catch’s 153 fish and the diagram’s 153 distinct blocks supply the numerical correspondence.
File 54 presents this as a suggestive theological and reception-history reading. John 21:11 supplies the fish count. The chronological model supplies the 70-year scale, the chosen boundaries and the common center. Their agreement invites reflection, but does not establish that John composed the catch narrative to encode this model or that one Gospel borrowed it from another.
The value of the illustration lies in making that proposal understandable and open to examination. Readers can trace the biblical ages, inspect the selected units, count the shared center and judge the interpretation with each step in view.
Continue to the tables, coordinate diagram and source notes, especially the overlap table and evidence-and-interpretation summary. For the full treatment, read the detailed study.
Scripture quotations: Berean Standard Bible (BSB), public domain.
Scripture references link to the identified BSB edition; calculations in the article are the study’s own.